Kitesurf vs Playwright + Chromium: a 25-site screenshot benchmark
Allscreenshots12 min read
Find out how easy it is to capture and share pixel-perfect screenshots at scale using Allscreenshots. Sign up for a free account and start integrating your first screenshot API call today.
Cloudflare open sourced Kitesurf on November 13. We had just been optimizing Allscreenshots’ Playwright and Chromium capture path, so we built a standalone comparison against the new engine.
We ran 25 public websites through both stacks on the same machine, saved the images, kept the failures, and measured latency, CPU and memory. The first question was whether each stack could produce a screenshot. The more useful question turned out to be what was actually in that screenshot.
Our optimized API completed 37 of 50 measured captures. Kitesurf completed 39 of 50. Across the 17 sites with successful paired captures, Kitesurf’s aggregate latency ratio was 2.43× the API’s. But some “successful” images were error pages, loading placeholders, or nearly blank frames. That ratio does not establish a finished-page speedup for Chromium.
This is a two-round compatibility experiment on Linux ARM64 inside a VM on an Apple M2 Pro. It is a useful first look, with inspectable evidence. It is too small and too loosely controlled to settle a production browser choice.
Kitesurf speaks CDP, but its rendering implementation is distinct from Chromium. Cloudflare’s open-source announcement describes an engine built around Rust libraries compiled to WebAssembly, with HTML/CSS layout and painting, page JavaScript, and separate session, script and renderer components. We connected Puppeteer to its locally built engine through CDP.
The Chromium participant used Allscreenshots’ existing Java capture-core, the shared implementation used by our API and capture agents. We invoked the real capture entry point without starting the backend server, authentication, billing or a database. Its profile included:
Prepared, unused about:blank contexts, consumed once. Previously visited contexts were never recycled.
Direct viewport capture and native WebP encoding, avoiding an intermediate PNG and JVM re-encoding.
Blocking of explicit future-navigation prefetch hints, while preserving ordinary page resources.
The production Linux frame scheduler, including its normal fallbacks. This scheduler can advance page JavaScript time; elapsed benchmark time still used a real monotonic clock.
The versions were Playwright Java 1.64.0, Chromium 156.0.8078.4, and Java 25.0.5. Kitesurf was pinned to commit 4a2903813a22b08d4f3cc64a4b35339d0293a5d1, controlled with Puppeteer Core 25.16.0 on Node 24. We verified that this Kitesurf build could emit WebP directly, so PNG-to-WebP conversion was unnecessary in the measured run.
These measurements compare complete capture strategies, including their language runtimes and readiness behavior. We did not add a separate stock Playwright baseline, so this experiment cannot isolate the benefit of our earlier optimizations.
The experiment and its boundaries
Setting
Value
Pages
Fixed corpus of 25 popular public sites; not a traffic ranking
Output
1920×1200 viewport, DPR 1, WebP quality 90
Isolation
Fresh page state for every capture; no supplied login credentials
Resources
Separate containers, each limited to two CPUs and 4 GiB RAM
Execution
One active capture at a time on the same Linux ARM64 VM
Warmups
One untimed attempt per site and stack: 50 total
Measured rounds
Two per site and stack: 100 total
Ordering
Seeded site shuffling; stack order reversed in the second round
Deadline
60 seconds for each capture; benchmark failures were not retried
Optional cleanup
Ad, cookie-banner and popup removal disabled
We extracted applicable loader, visual-readiness and image-recovery JavaScript from the API source for Kitesurf, along with the shared viewport resource sampler. We also applied the explicit prefetch-header policy to its requests. Both stacks passed local fixtures for visible text, hydration, images, animation, canvas, isolation and WebP dimensions before the corpus run.
The resulting policies still differ. Chromium retains our frame scheduler and capture fallbacks; Kitesurf uses its own clocks and rendering behavior, with finite animations finished and infinite animations canceled before capture. User-agent behavior and security checks were not normalized. The API image used Ubuntu Noble and the Kitesurf image used Debian Bookworm; installed font versions and renderer font fallback were not identical.
We also fetched live pages independently. There was no shared HAR replay, fixed DOM, shared cookie state or synchronized animation frame. Ads, consent interfaces, geography, network responses and loading state can change the pixels. The difference images below show observed output differences, not a controlled measurement of rendering-engine correctness.
The capture timers included context setup, navigation, readiness, screenshot encoding and context disposal. Artifact file writes were outside the reported capture latency. Prepared-page refill was drained and charged to active work/CPU measurements. Builds and initial service startup were untimed. A container restart after a timeout could make a subsequent sample include recovery work; we did not silently discard those samples.
What the images actually show
The following examples use matching site and measured-round pairs. The left panel is the optimized API; the right panel is Kitesurf. The comparison previews are resized PNGs, while the linked WebPs are the original capture outputs. The expandable differences were calculated from the decoded original WebP pixels, without aligning, cropping, or masking them.
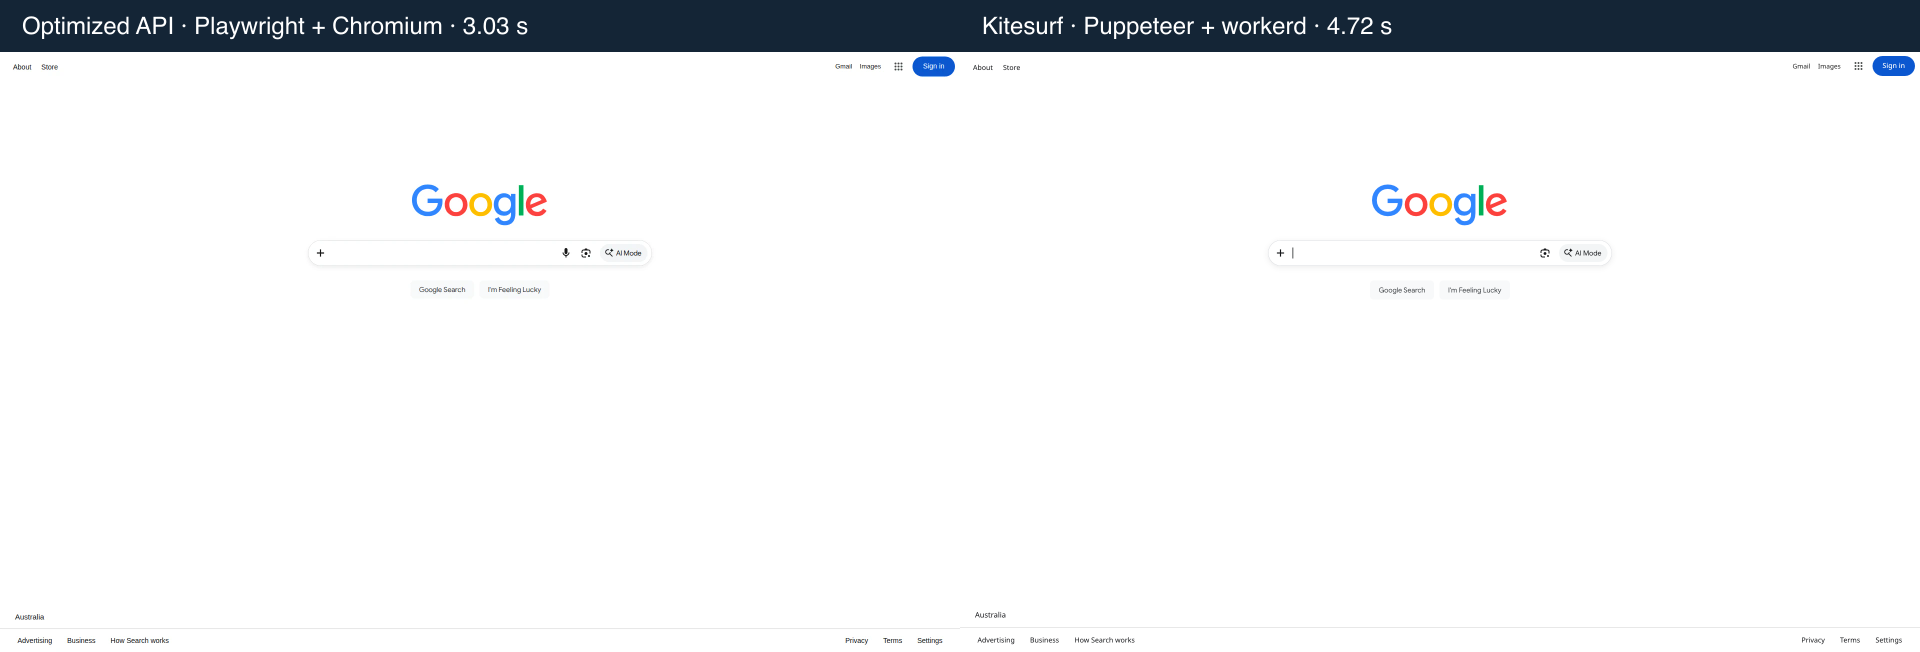
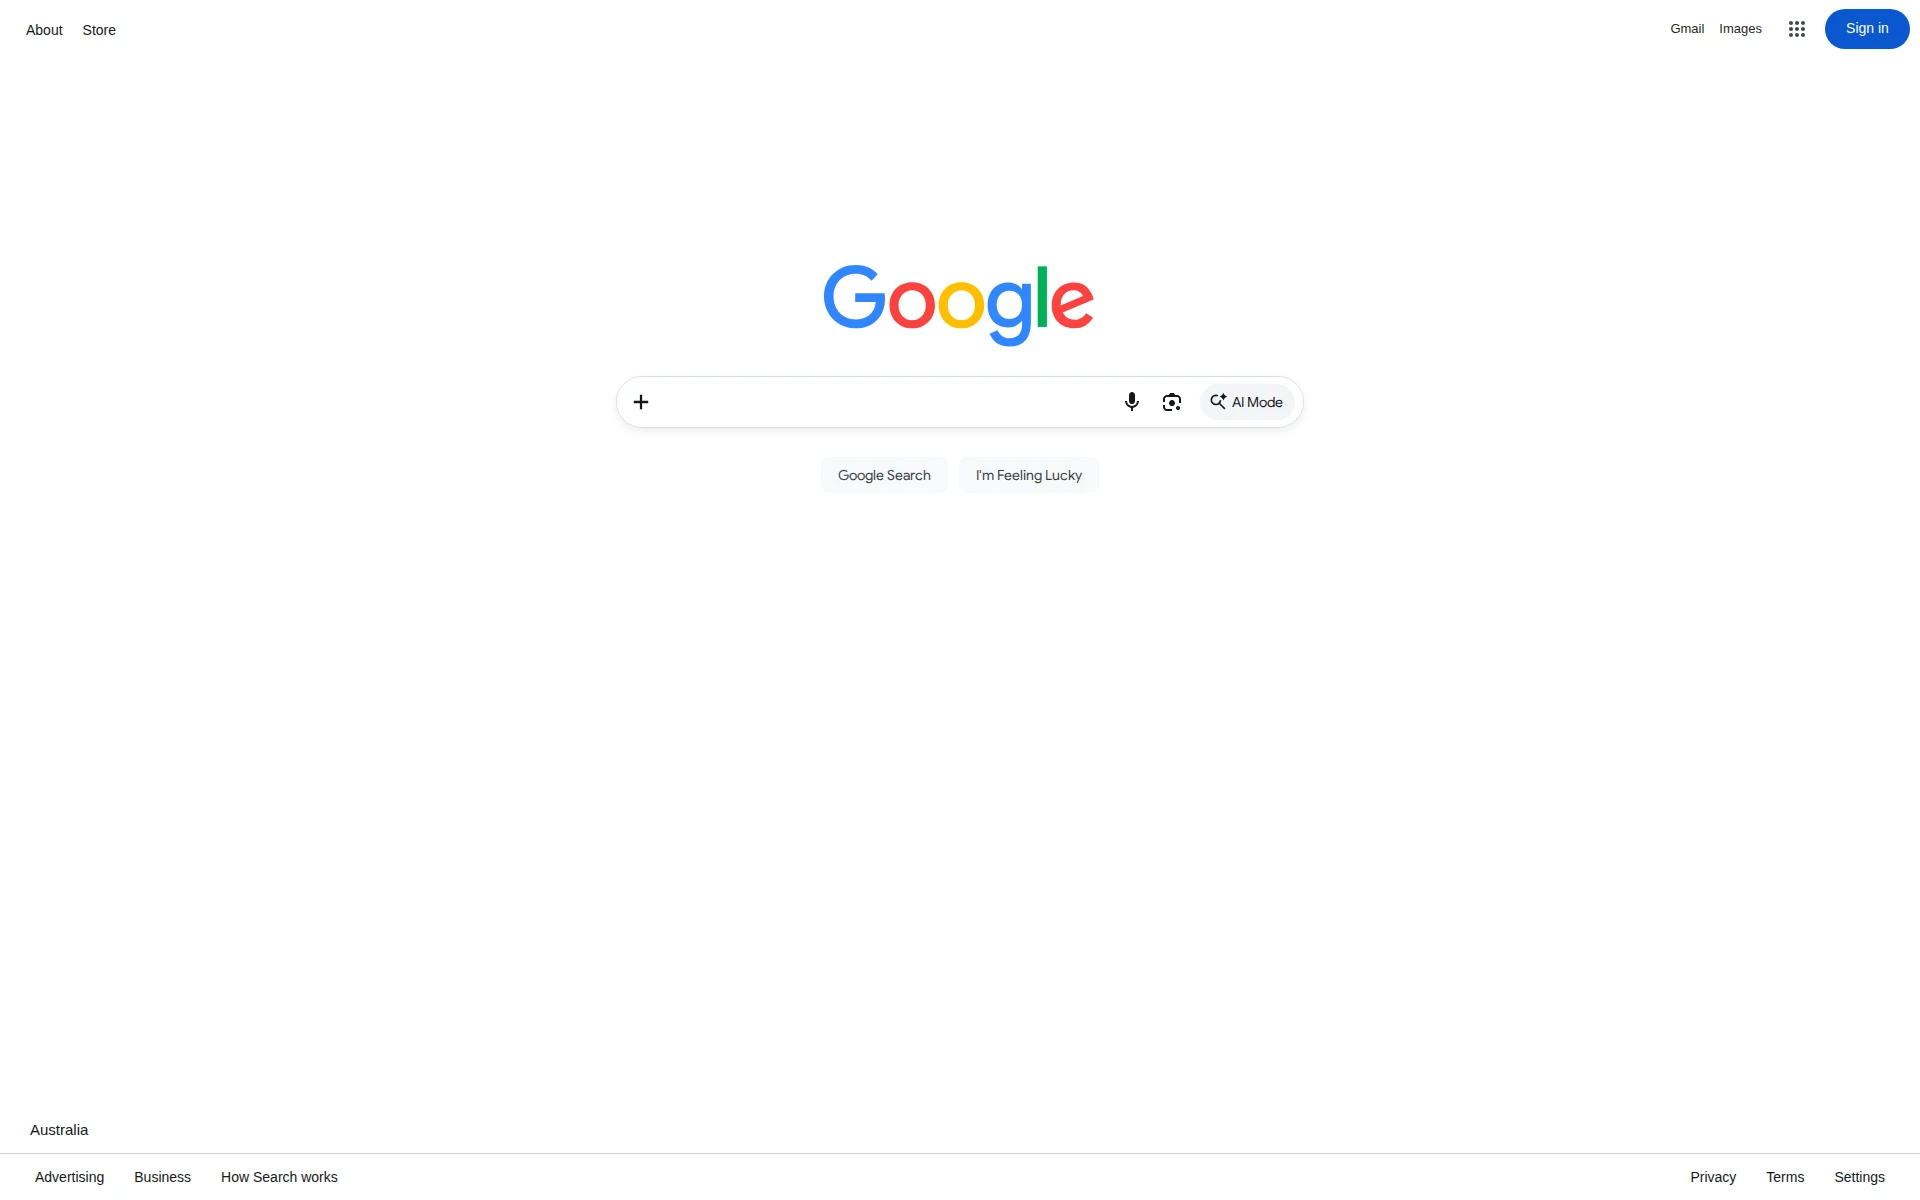
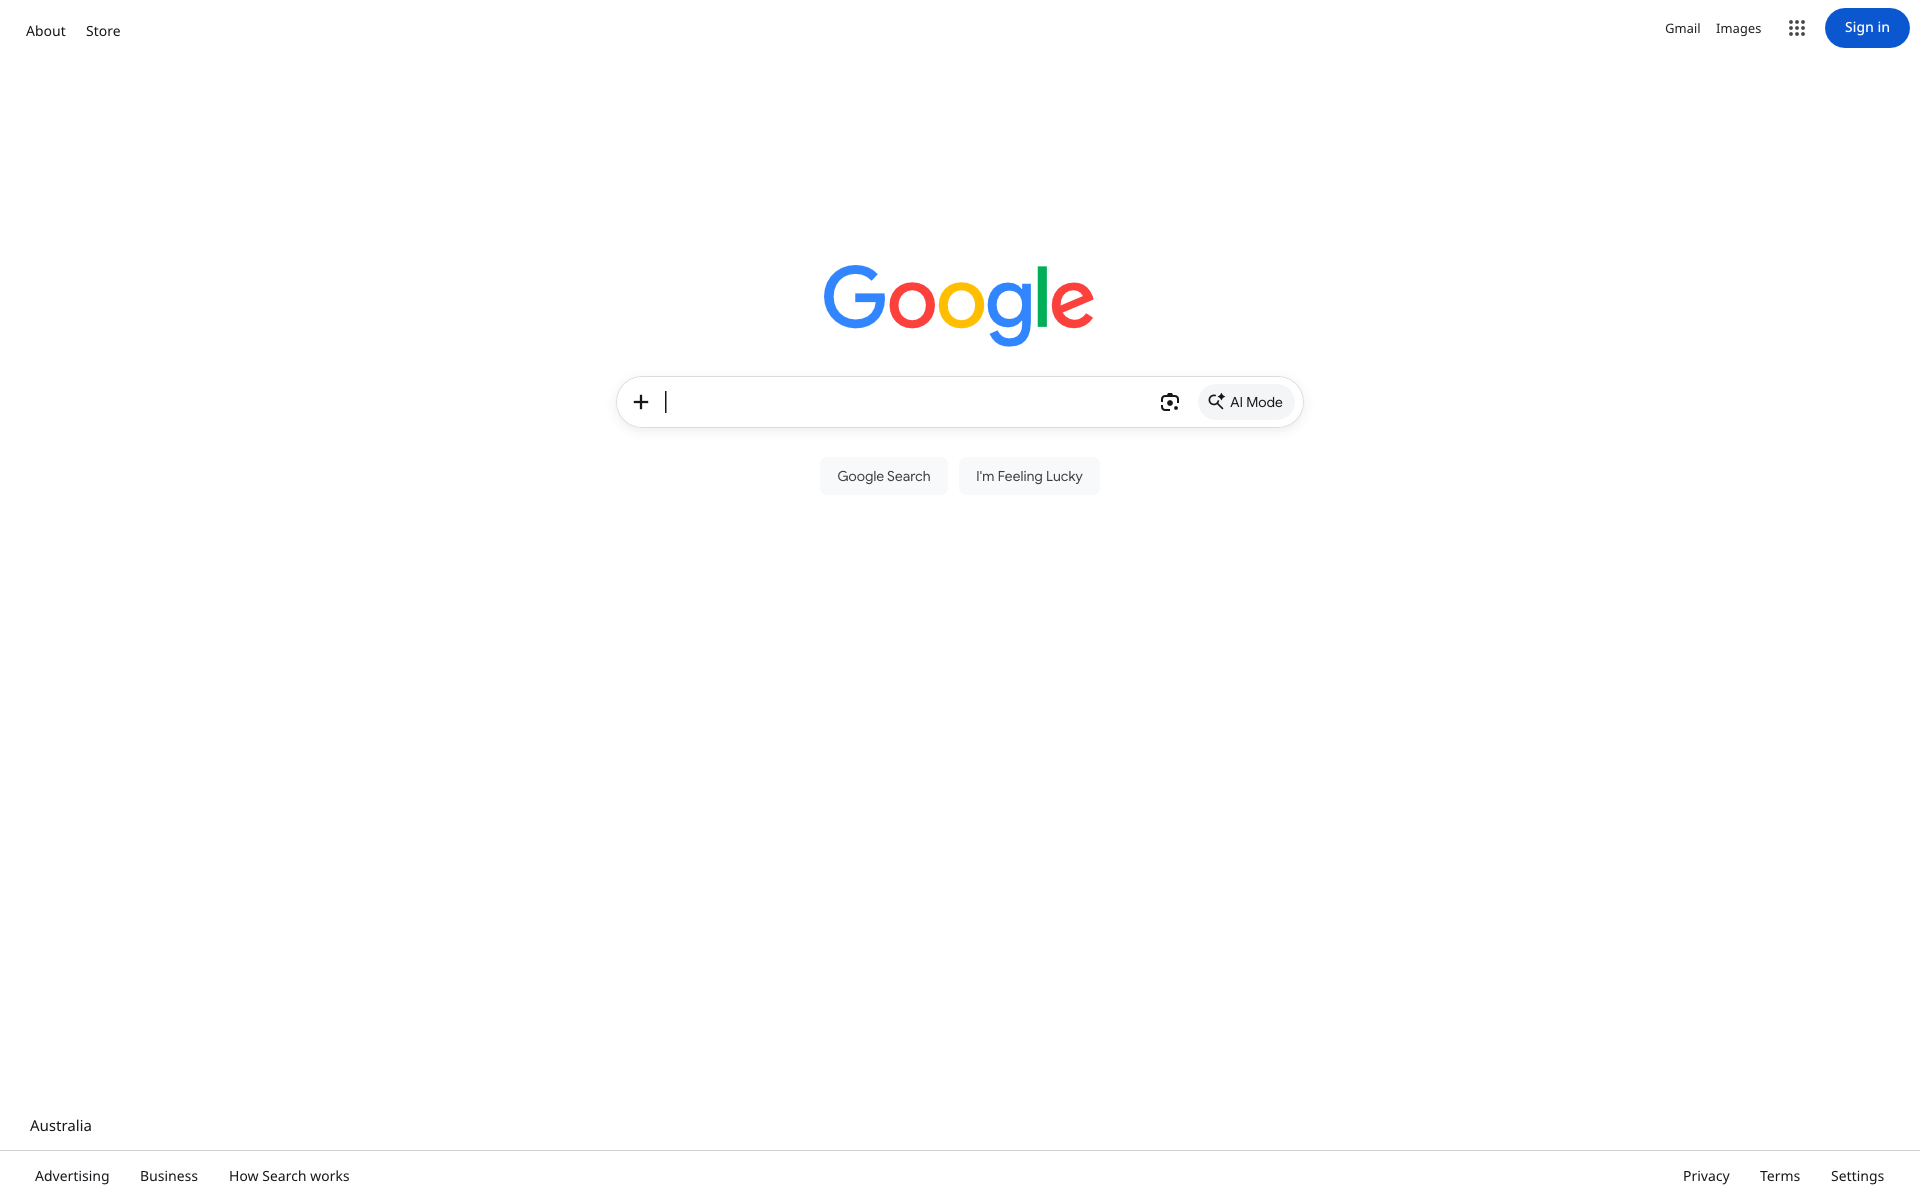
Google: a broadly similar page
Both captures show the familiar search page, with small differences around controls, spacing and text. This is the kind of page where the two outputs can look similar at thumbnail size while a pixel difference still lights up edges. It is a useful contrast with the larger state differences later in the article.
Both stacks returned Google’s search interface with HTTP 200. Small visual differences remain around controls and text. Measured round 0; previews reduced to fit. Open the original 1920×1200 API WebP or Kitesurf WebP.Inspect the Google pixel difference
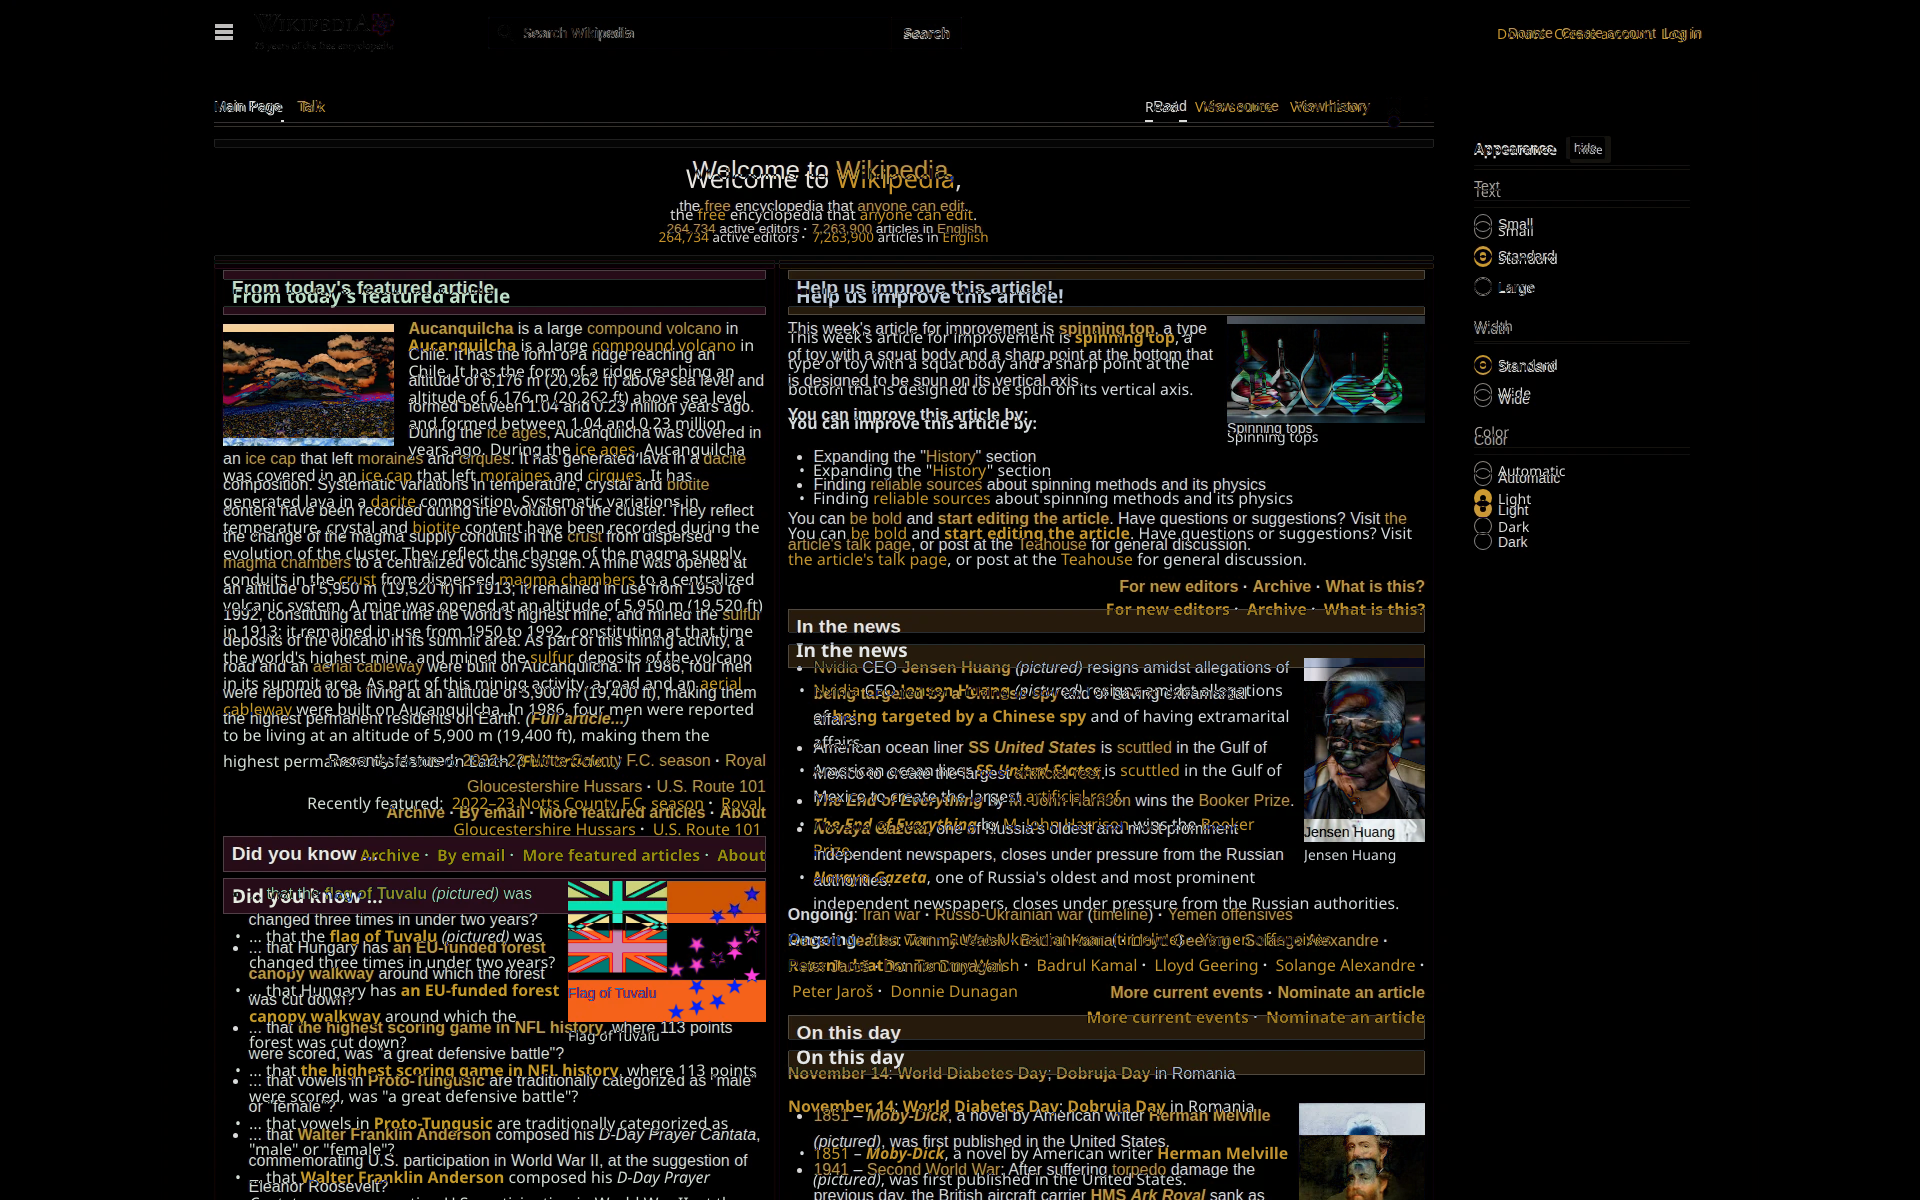
Dark pixels changed little; bright pixels changed more. This compares decoded WebP outputs, including different content and loading states. It is not a browser-conformance score. Click the image for the full-resolution PNG.
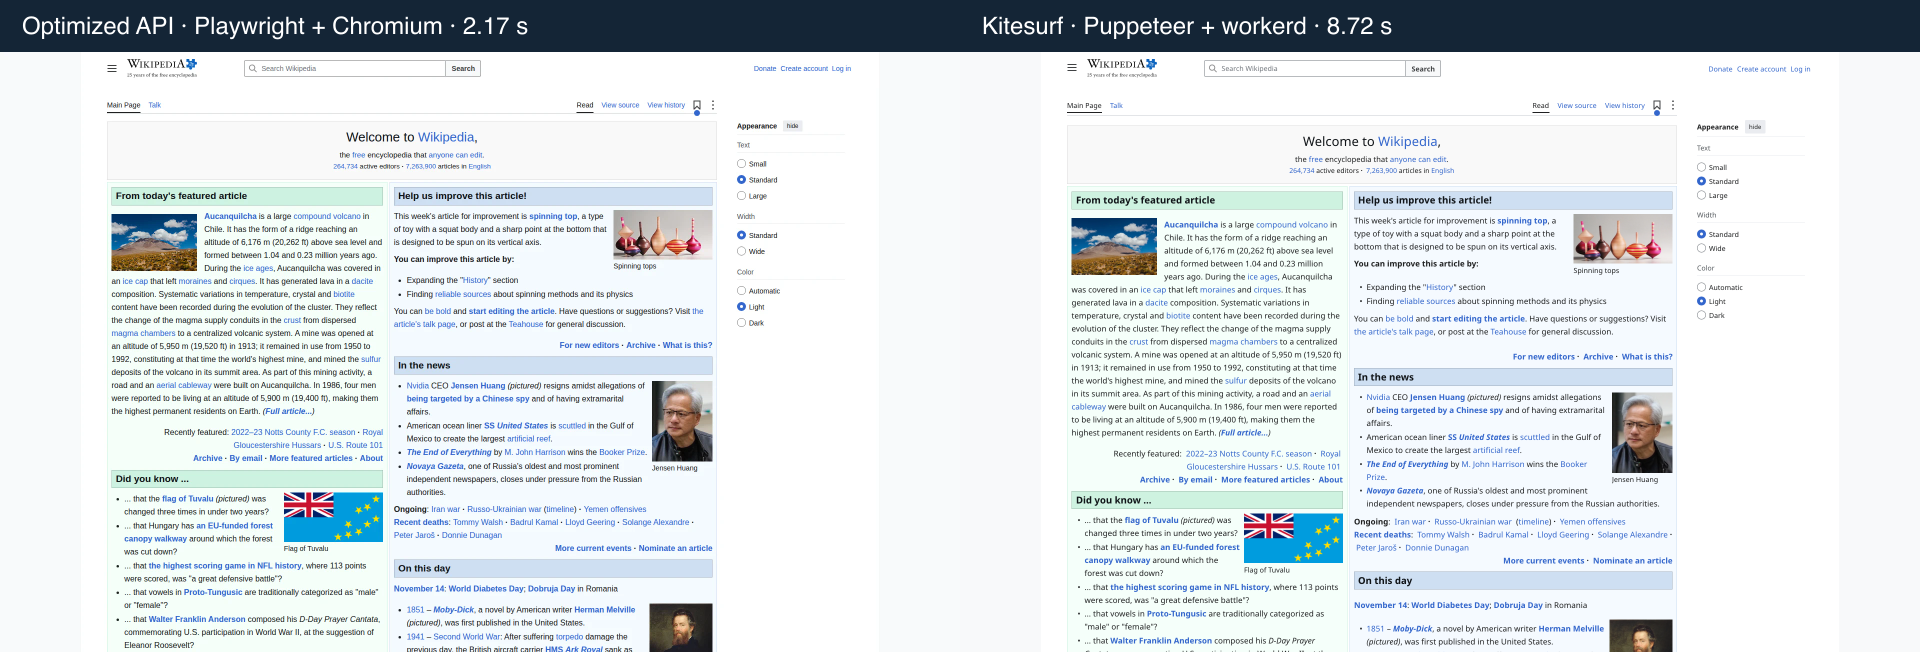
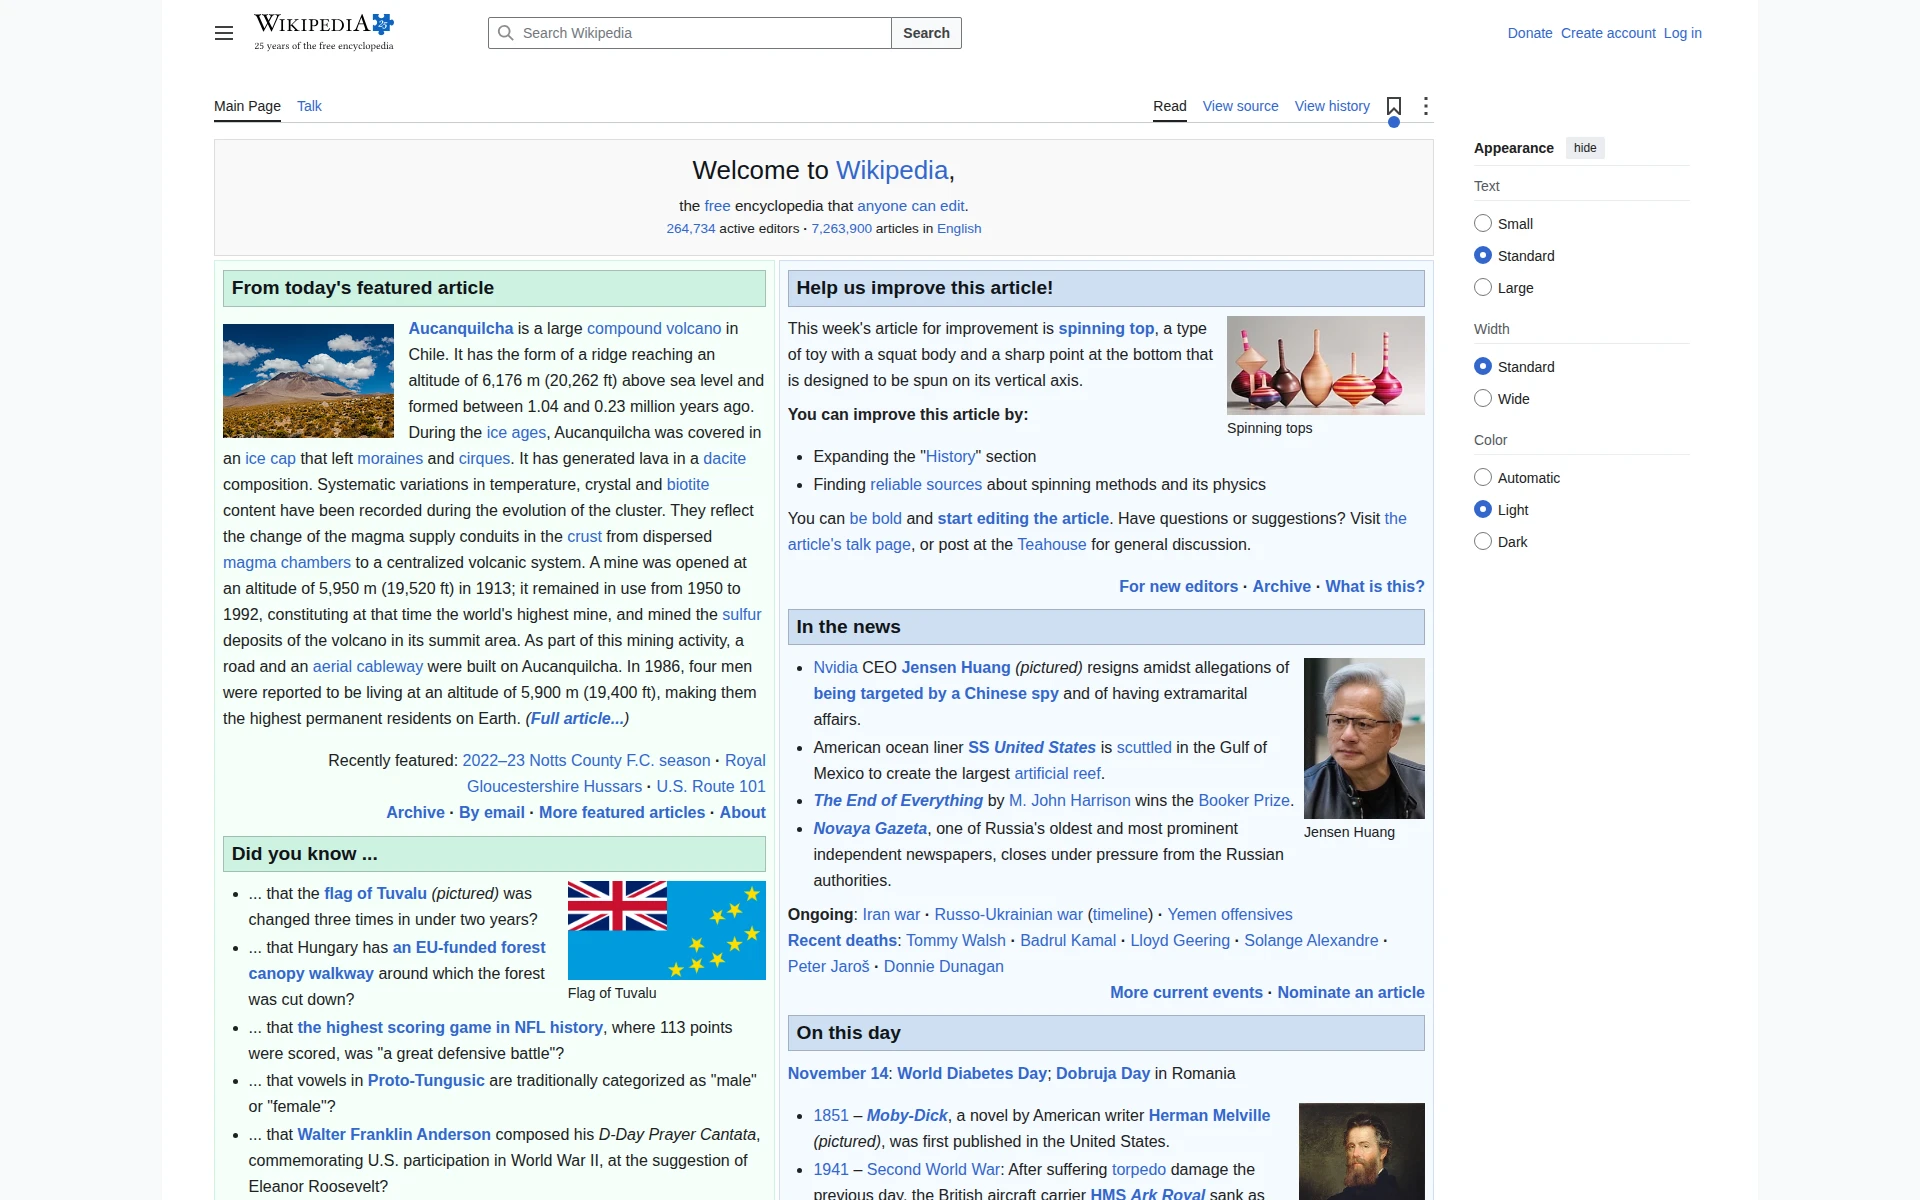
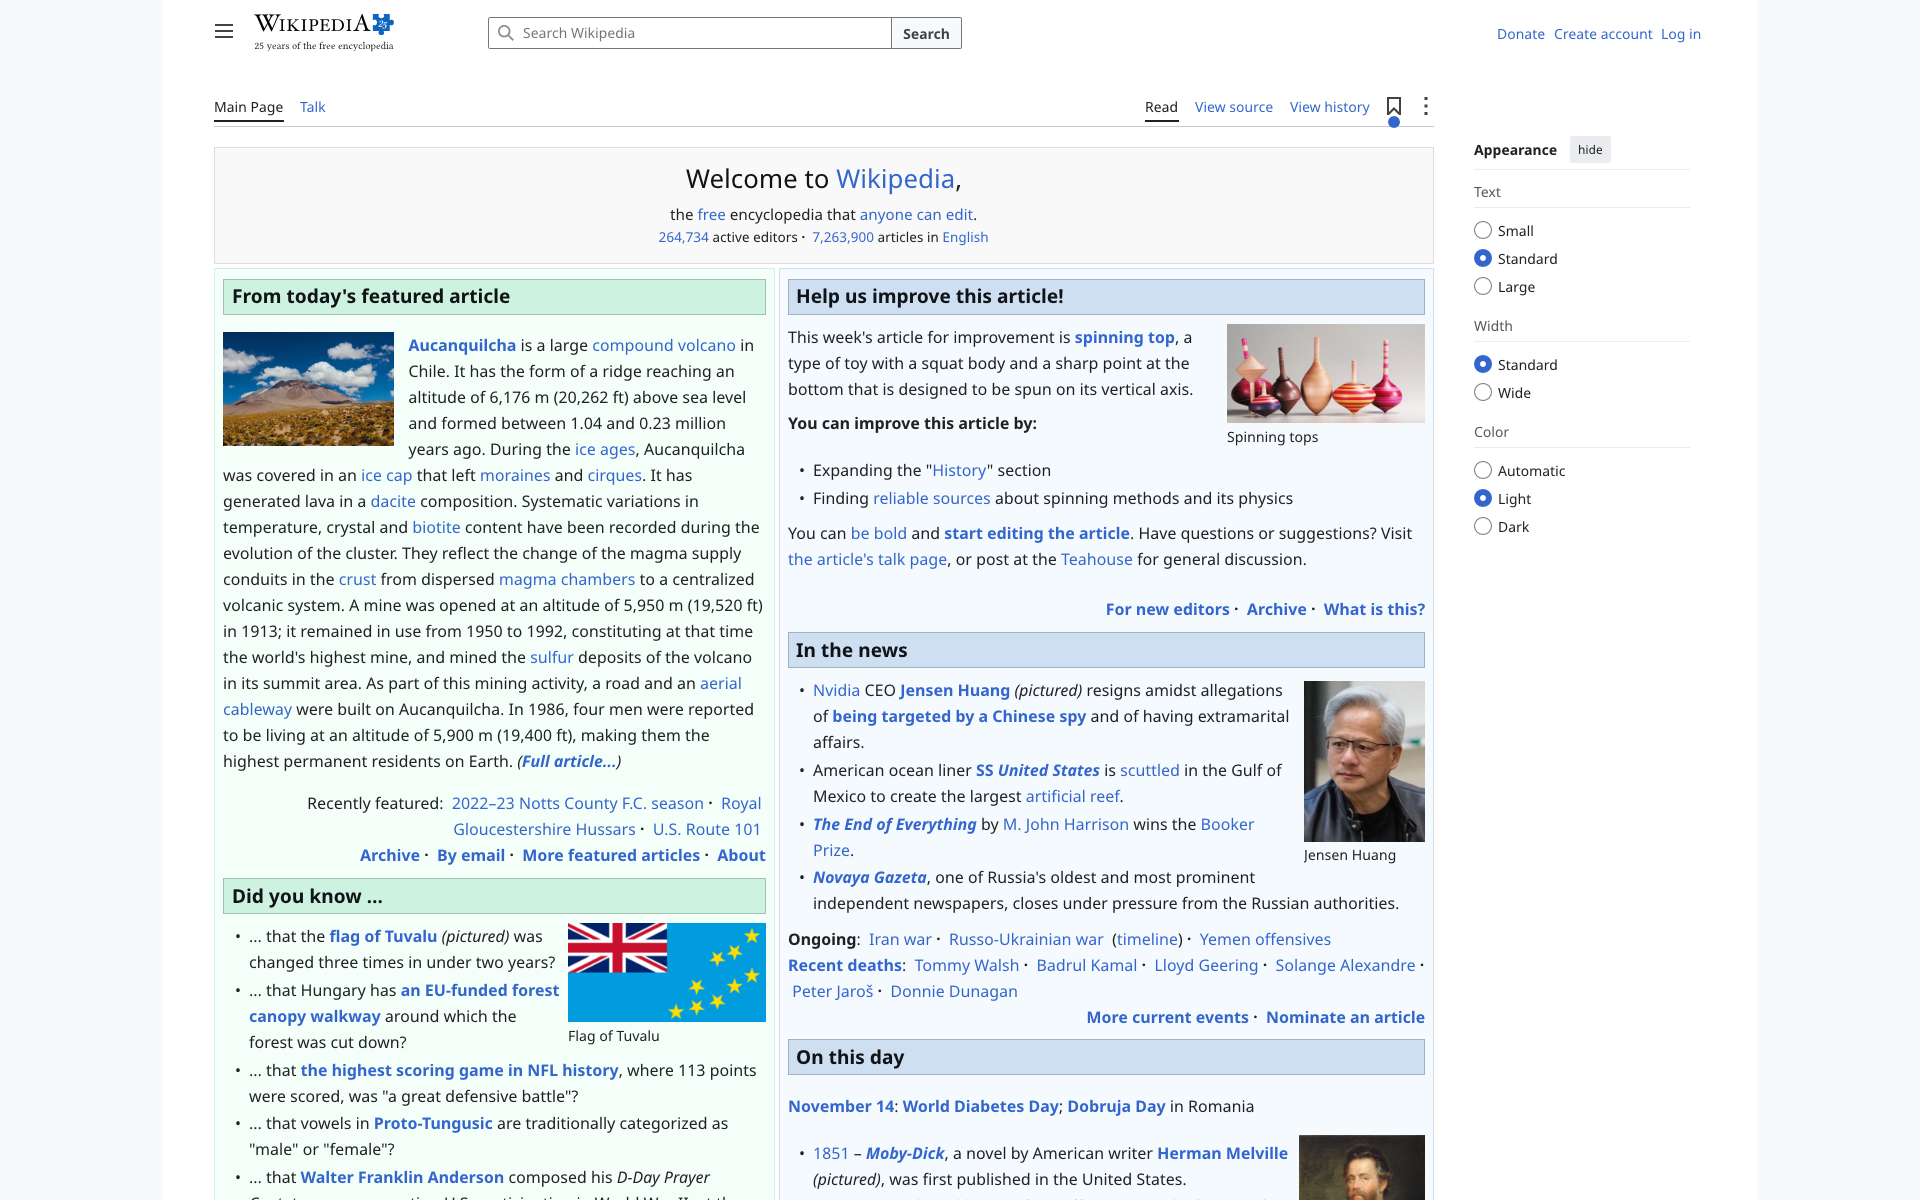
Wikipedia: readable content, different text flow
Both images contain the main article panels, illustrations and navigation. Text wraps and vertical positions differ, shifting the content farther down the page. A screenshot comparison can reveal that displacement, but this experiment cannot separate font fallback, layout behavior and different loading states as causes. We did not classify either output as pixel-equivalent.
The same Wikipedia main page remains recognizable in both captures. Compare paragraph wrapping, panel heights and the placement of lower sections. Measured round 0; previews reduced to fit. Open the original 1920×1200 API WebP or Kitesurf WebP.Inspect the Wikipedia pixel difference
Dark pixels changed little; bright pixels changed more. This compares decoded WebP outputs, including different content and loading states. It is not a browser-conformance score. Click the image for the full-resolution PNG.
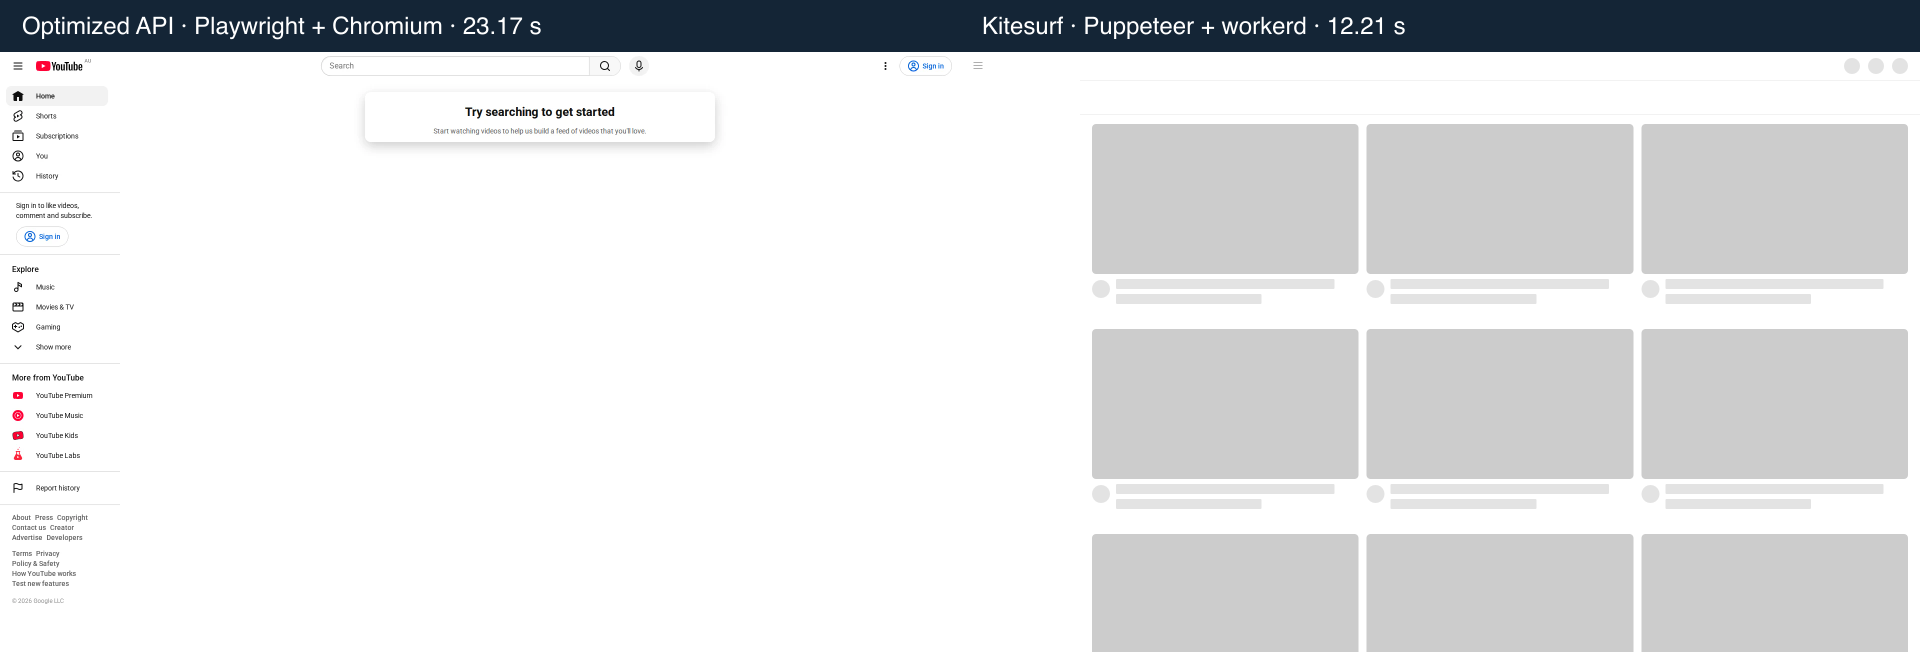
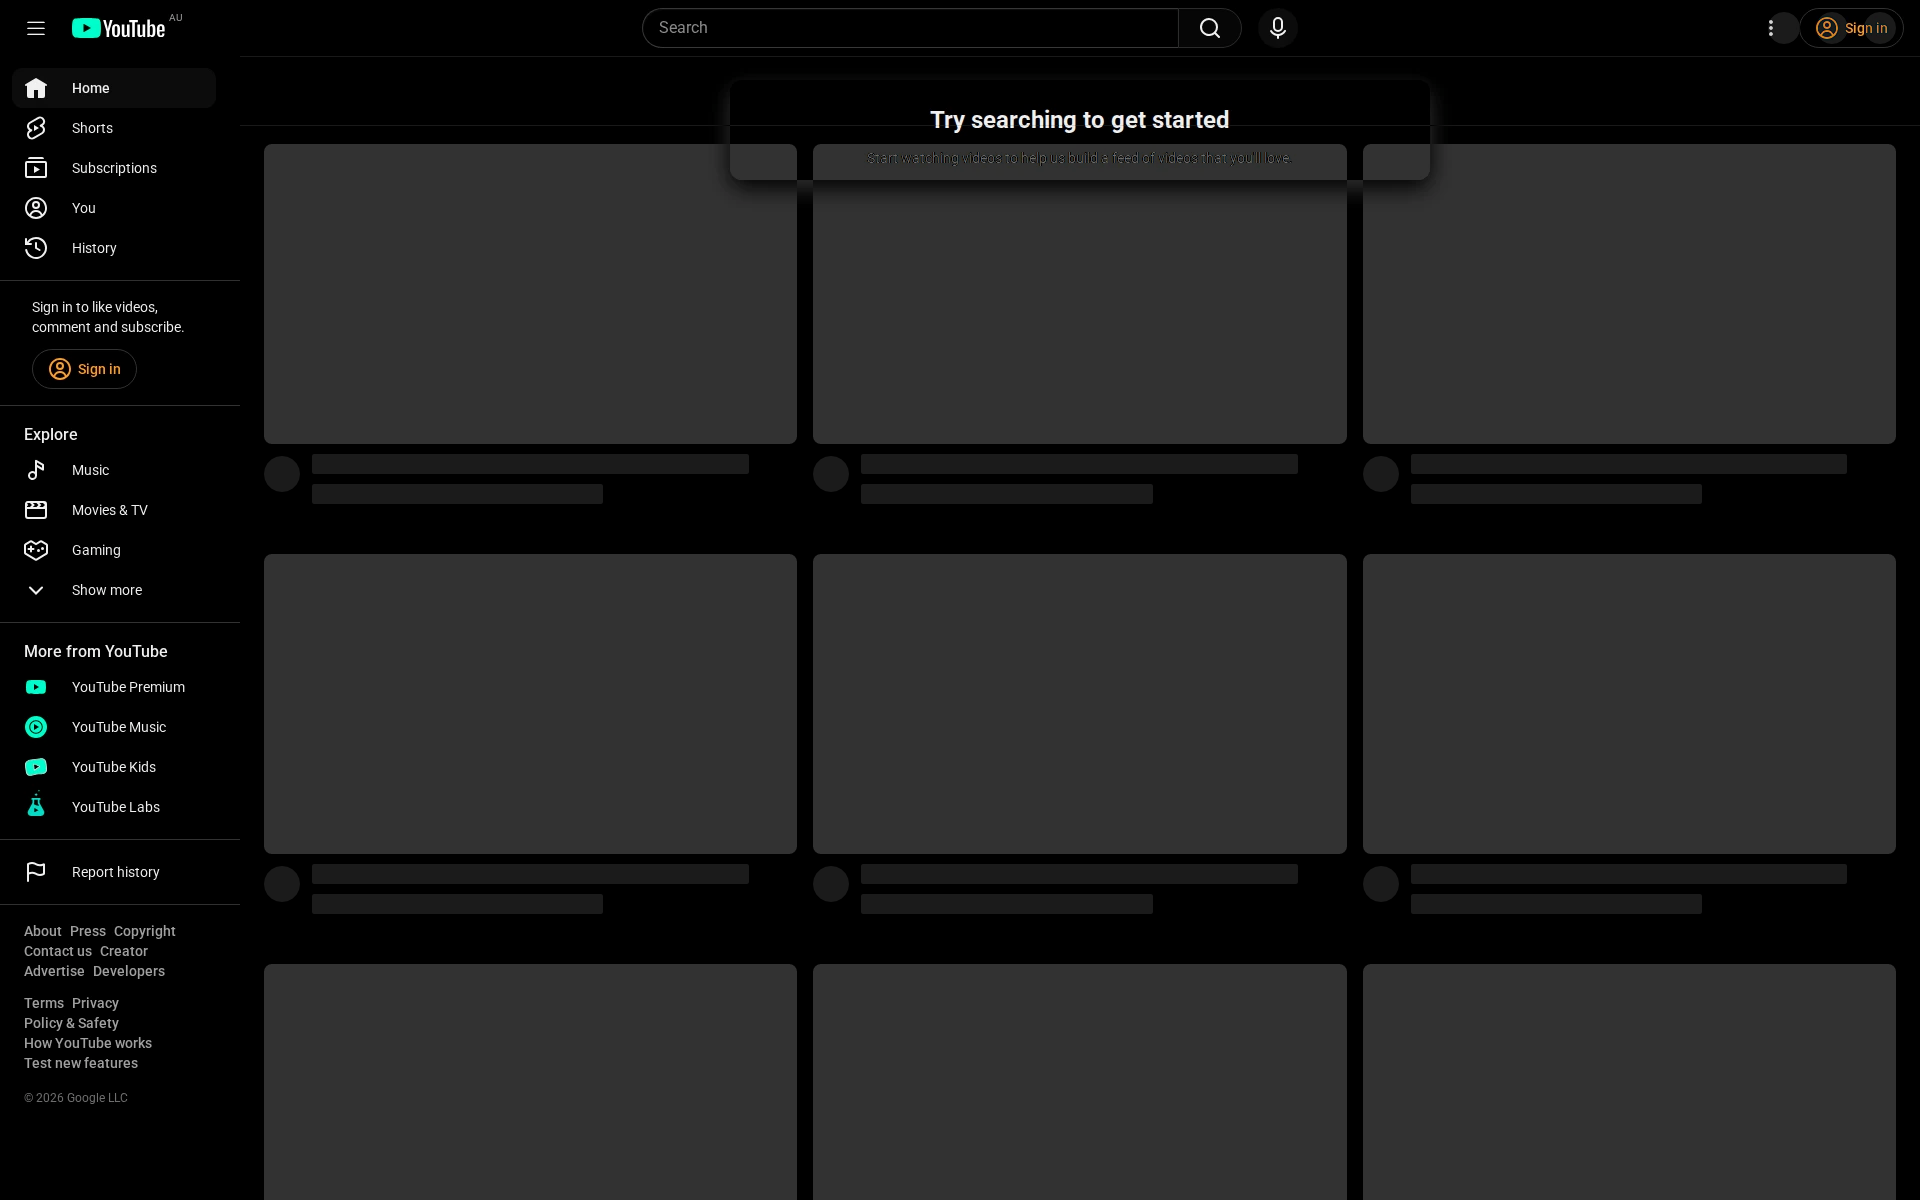
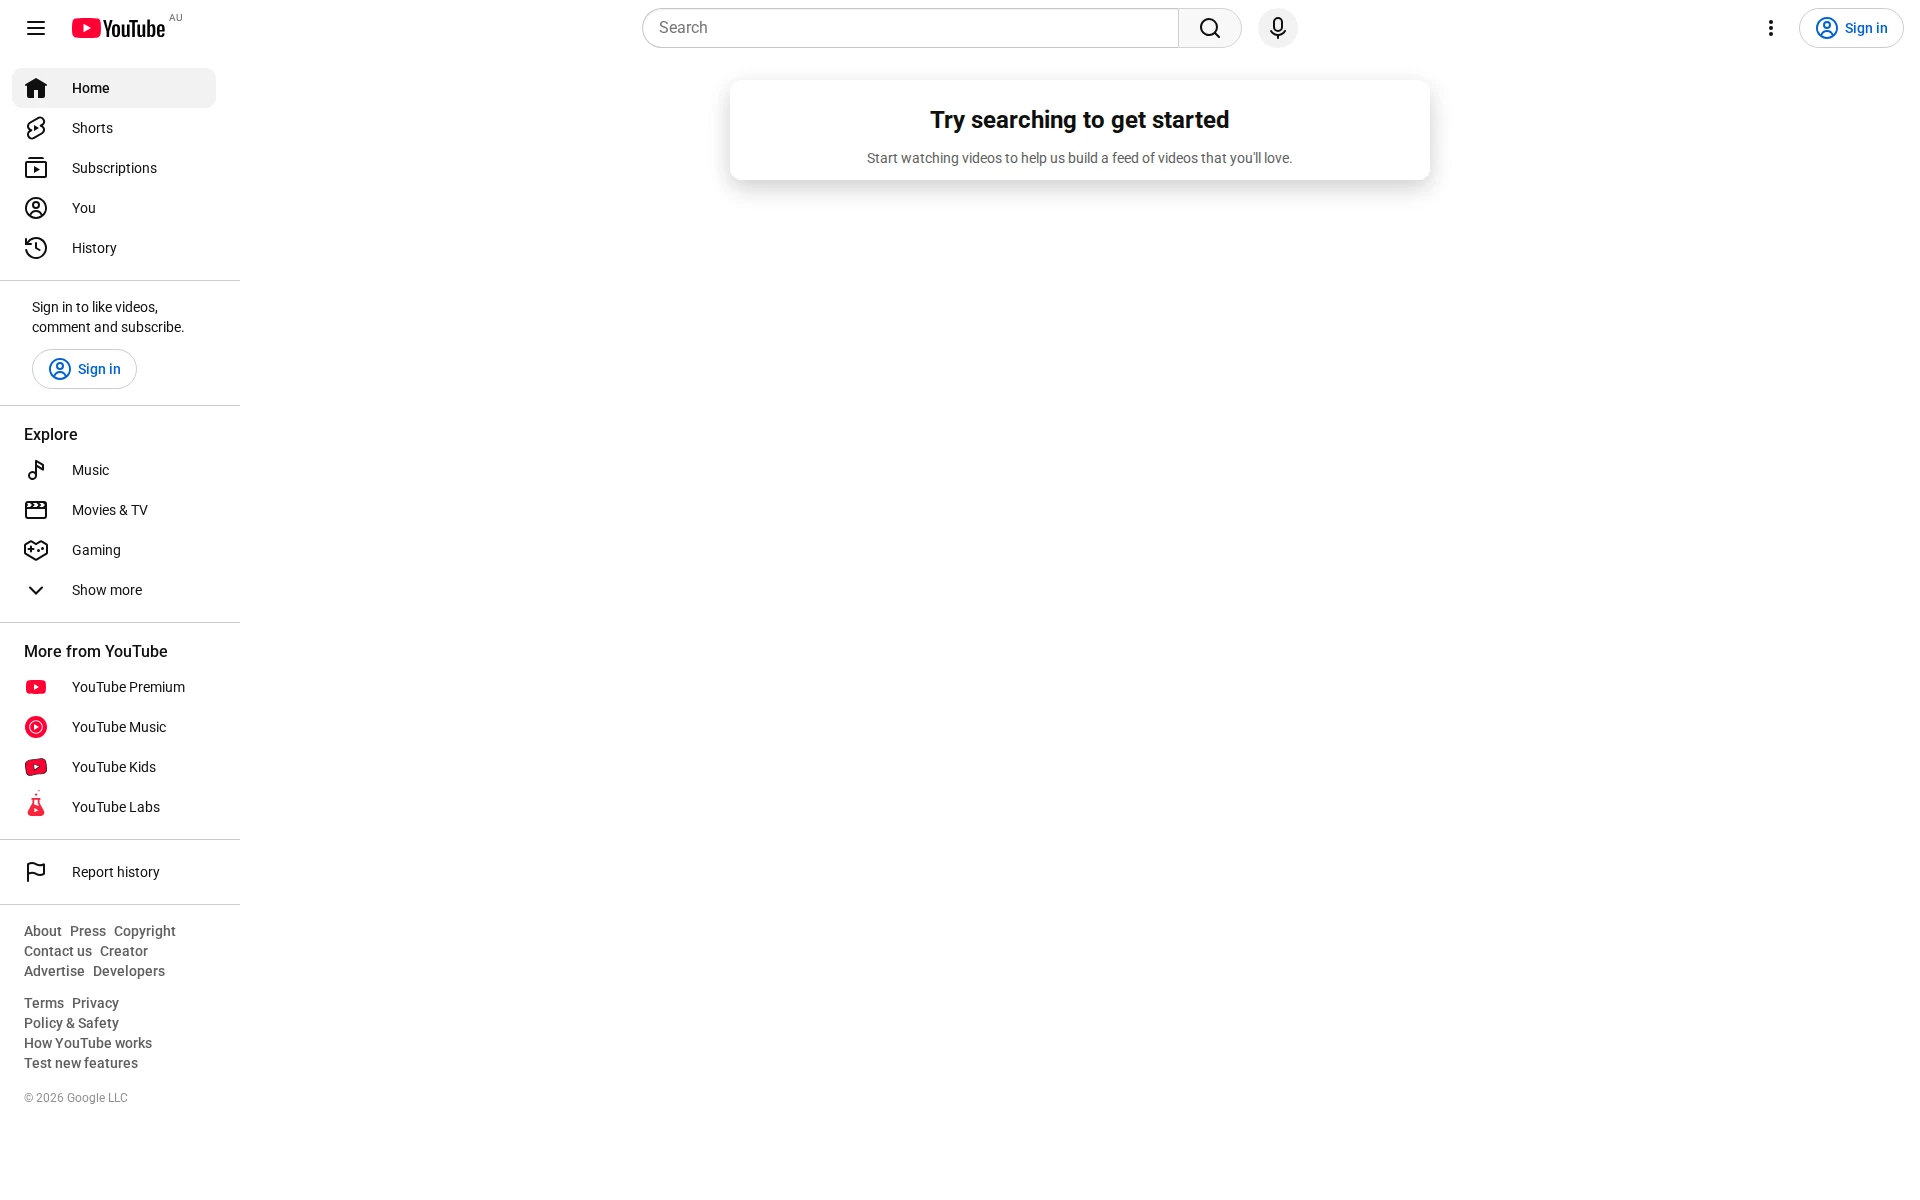
YouTube: the faster capture is still a skeleton
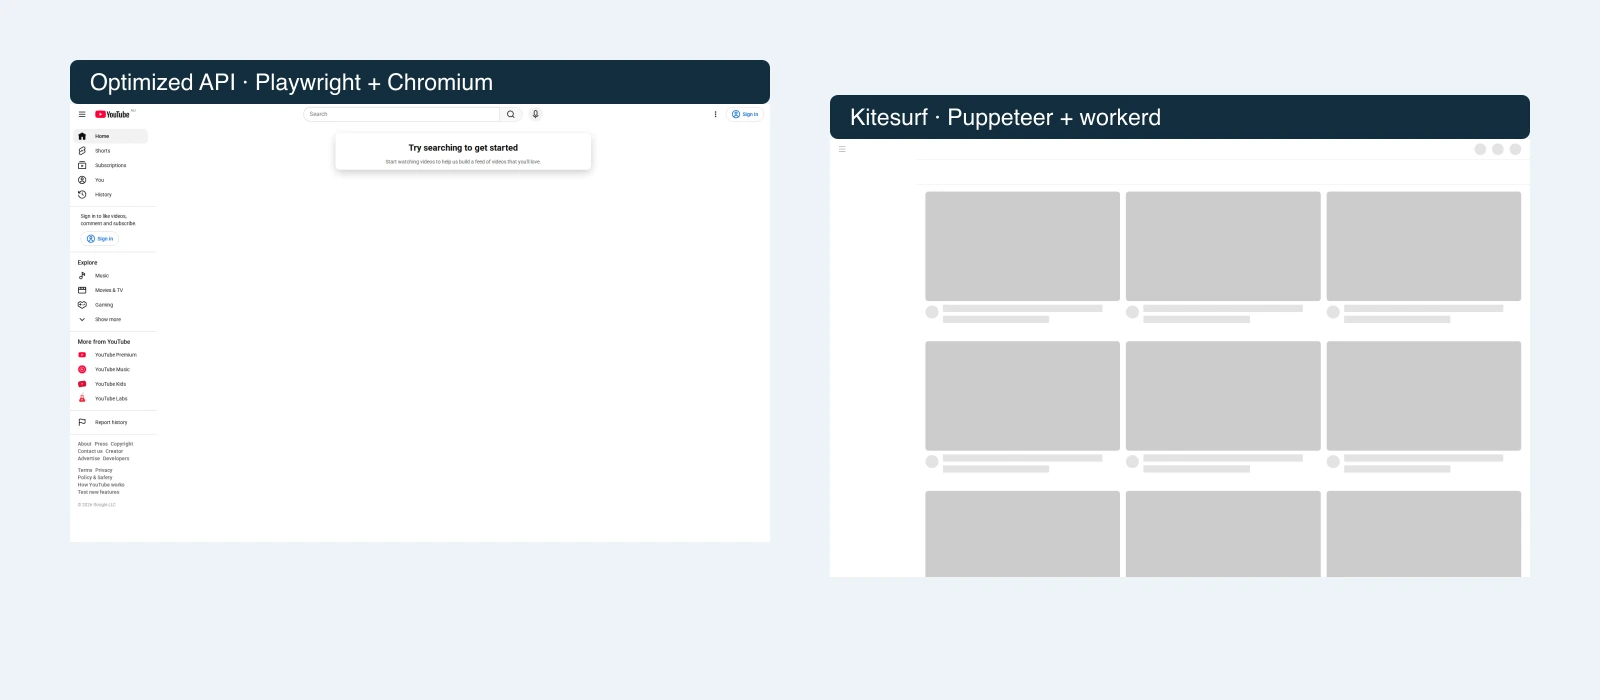
The API’s measured p50 was 23.17 seconds; Kitesurf’s was 12.12 seconds. Looking only at those numbers would make Kitesurf appear to deliver the page in roughly half the time.
In the selected pair, the API shows navigation and the signed-out “Try searching to get started” state. Kitesurf shows rows of gray video placeholders and a mostly unfinished interface. Both returned HTTP 200 and valid image files. They did not reach the same visible state, so these times are not a comparison of equivalent finished screenshots. This is a readiness/compatibility observation, not a video-playback test.
API: a resolved signed-out interface. Kitesurf: a loading skeleton. A valid WebP and HTTP 200 did not establish equivalent completion. Measured round 0; previews reduced to fit. Open the original 1920×1200 API WebP or Kitesurf WebP.Inspect the YouTube pixel difference
Dark pixels changed little; bright pixels changed more. This compares decoded WebP outputs, including different content and loading states. It is not a browser-conformance score. Click the image for the full-resolution PNG.
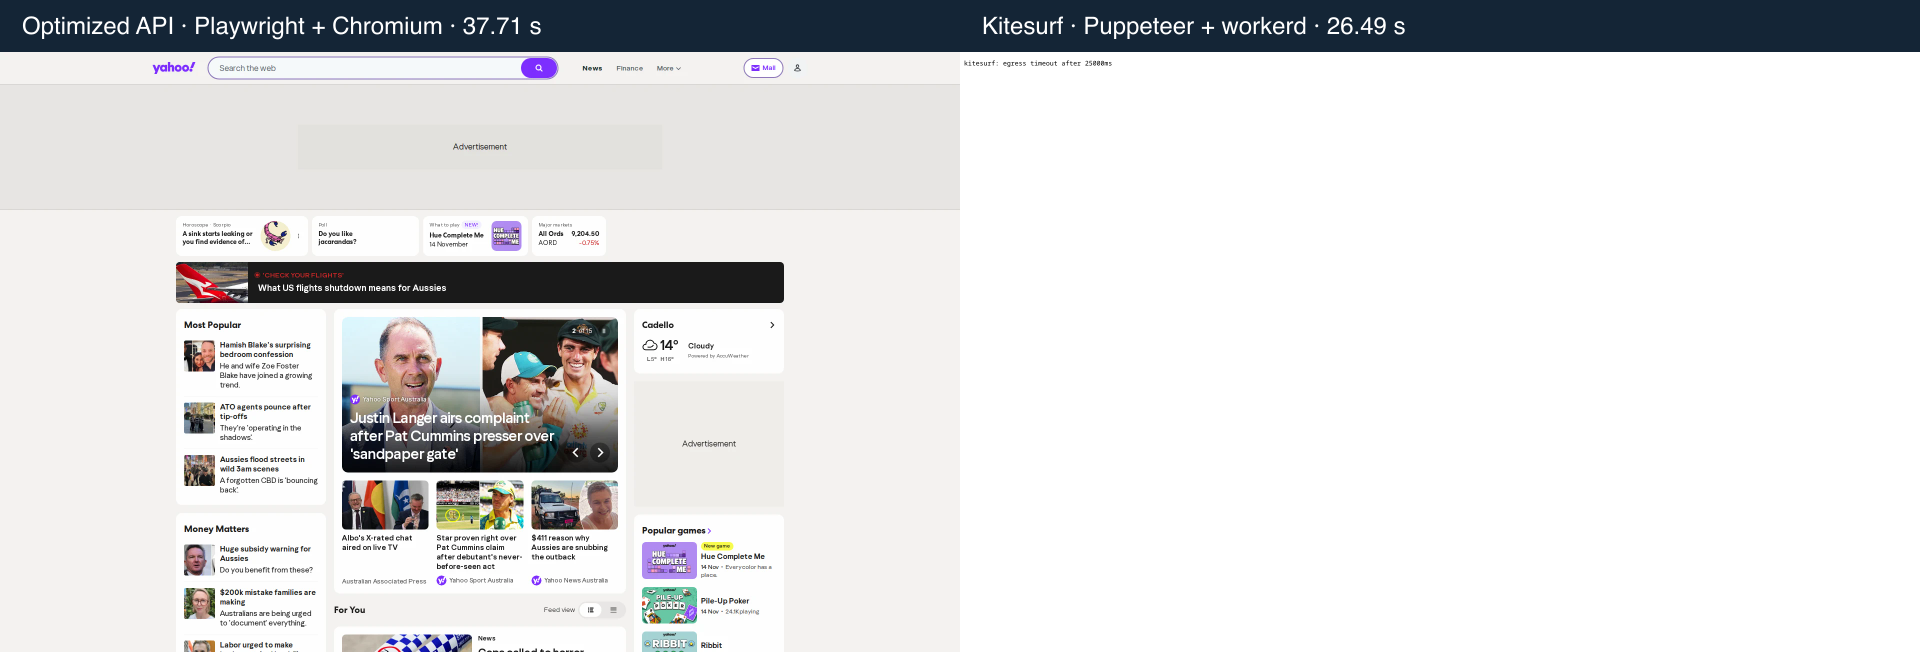
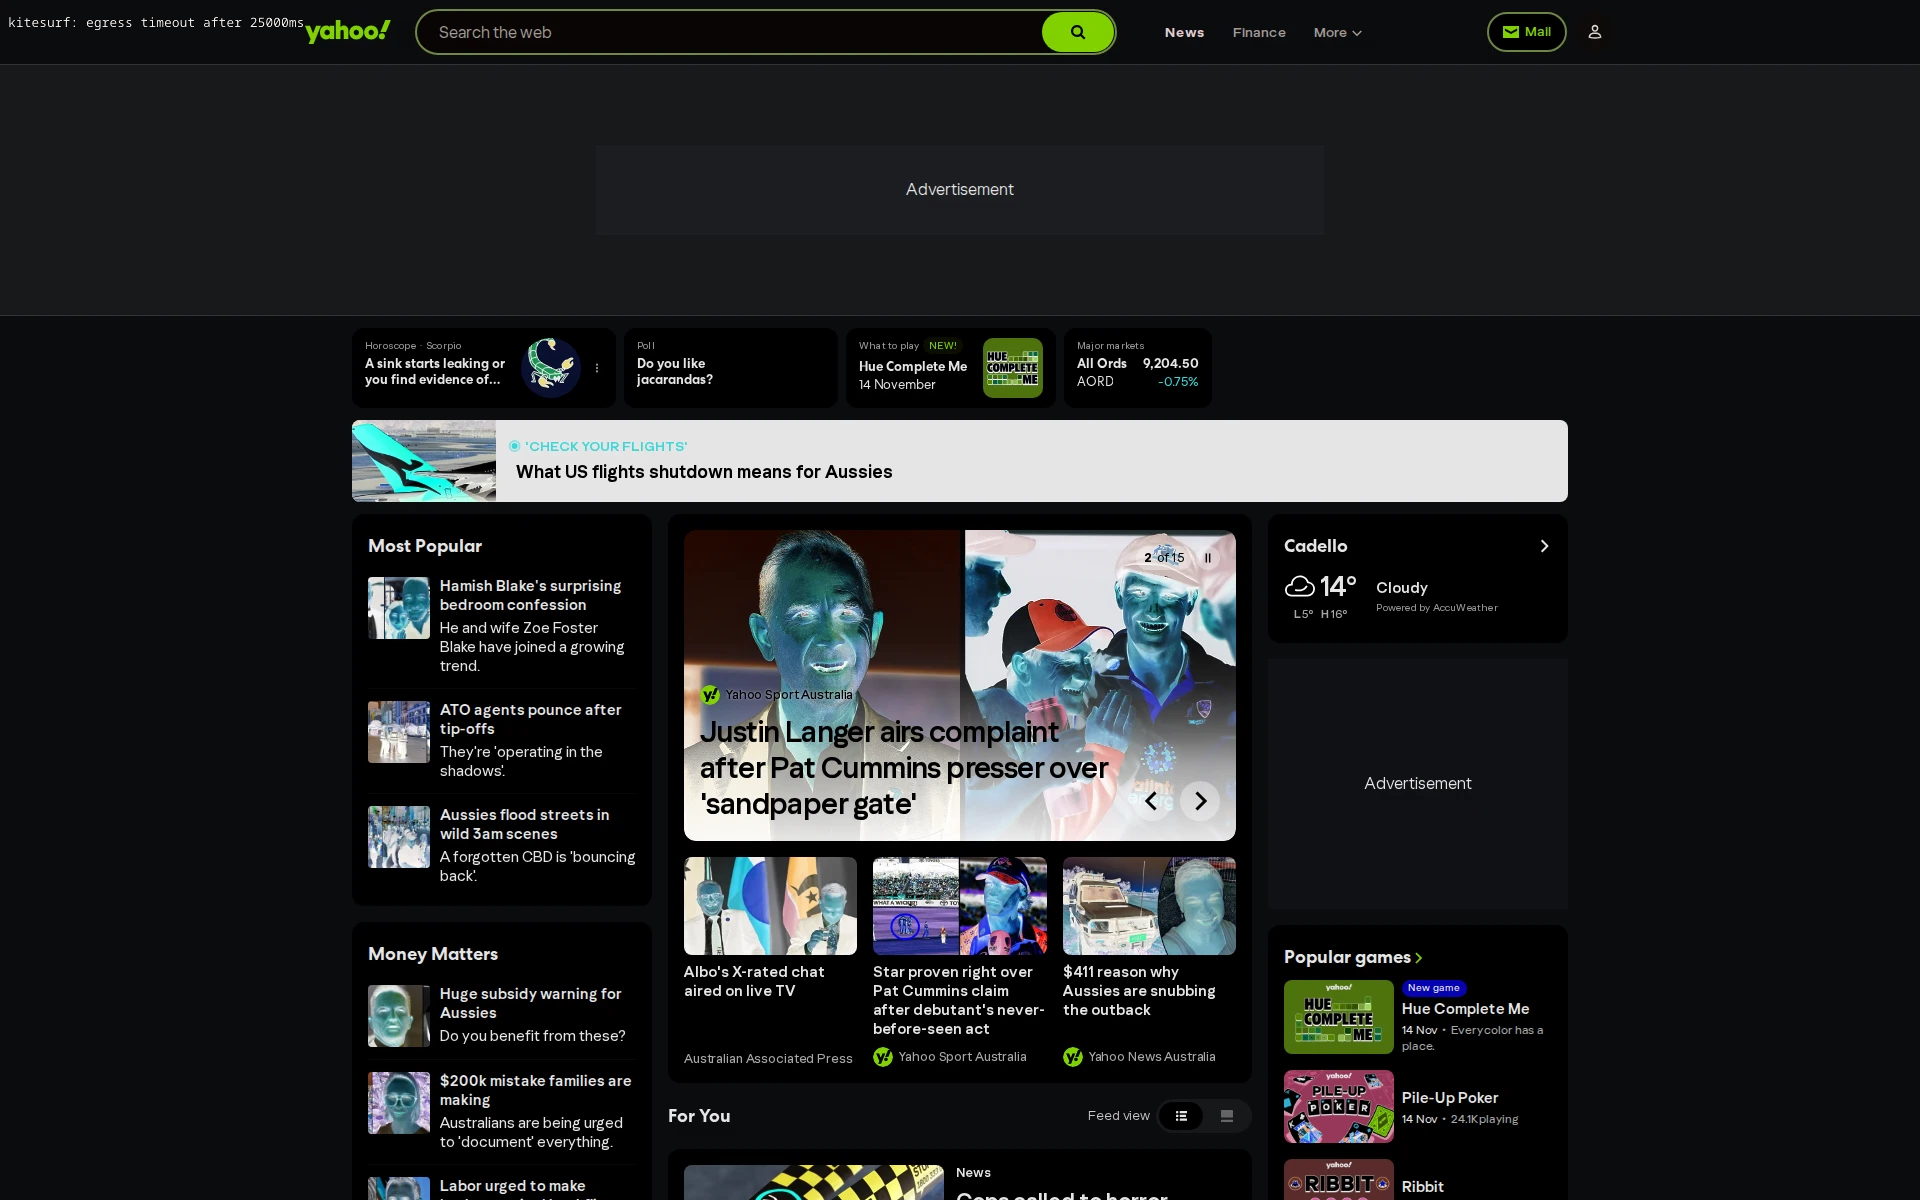
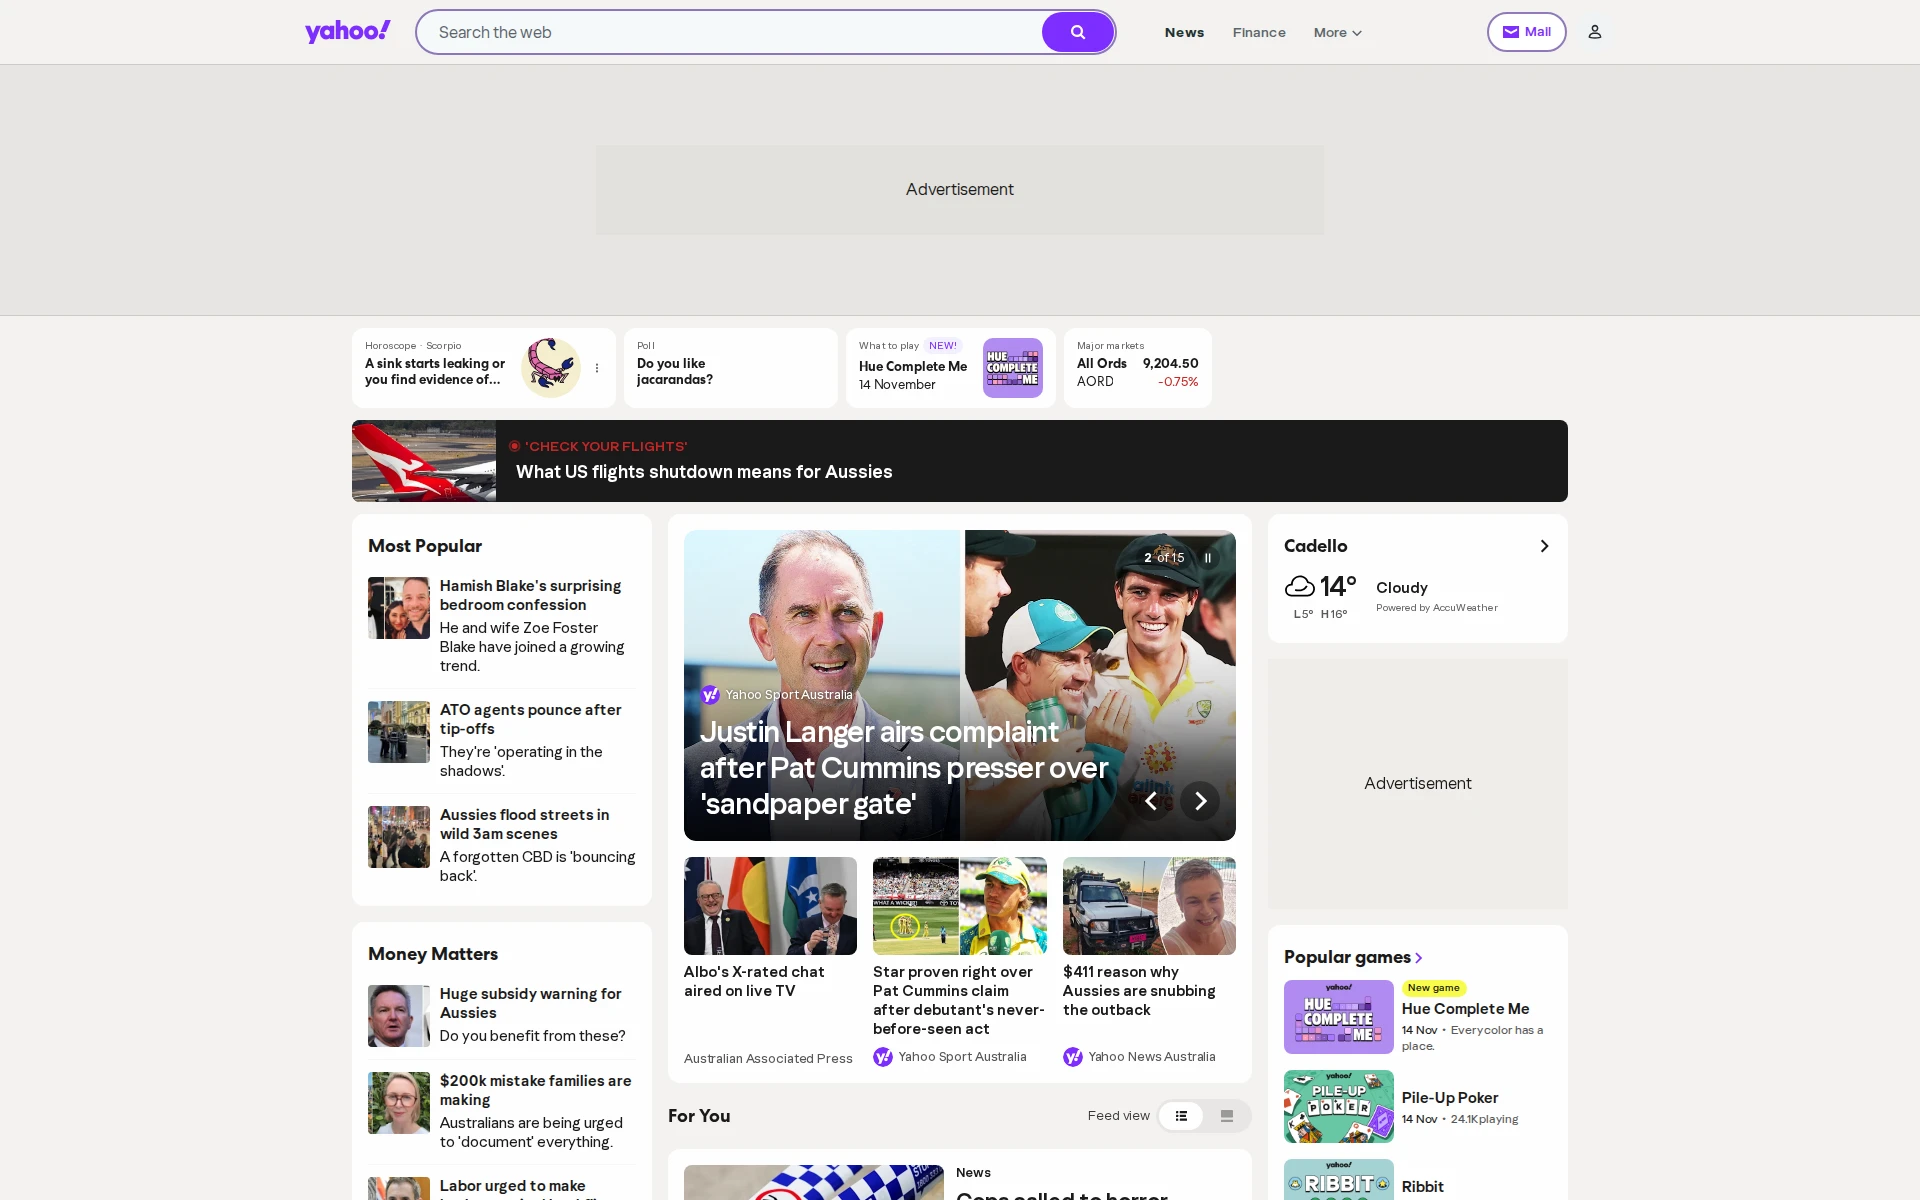
Yahoo: an image file can contain an error response
The selected API capture shows Yahoo’s news, weather and navigation. The Kitesurf capture is almost empty apart from an error line, and its recorded HTTP status is 403. In the other measured round, Kitesurf recorded HTTP 200, demonstrating that even the response outcome changed between attempts.
The 403 image remains in the capture-completion count because it is a valid screenshot. Calling it a successful Yahoo page render would be misleading. The report therefore exposes status information and the image alongside the timing.
The first measured Yahoo pair: populated API output versus an almost empty Kitesurf error capture with recorded HTTP 403. Measured round 0; previews reduced to fit. Open the original 1920×1200 API WebP or Kitesurf WebP.Inspect the Yahoo pixel difference
Dark pixels changed little; bright pixels changed more. This compares decoded WebP outputs, including different content and loading states. It is not a browser-conformance score. Click the image for the full-resolution PNG.
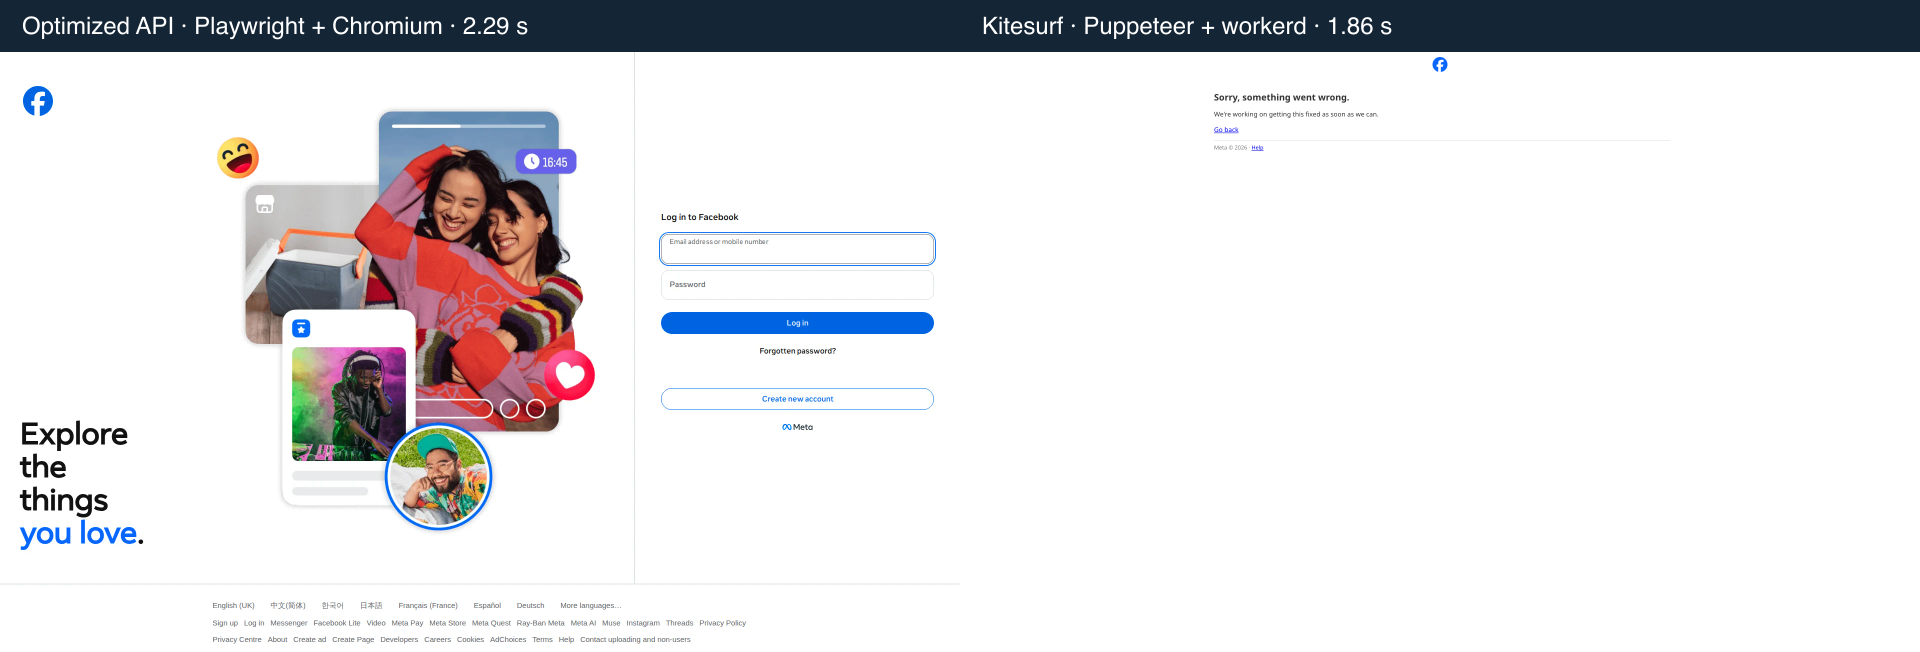
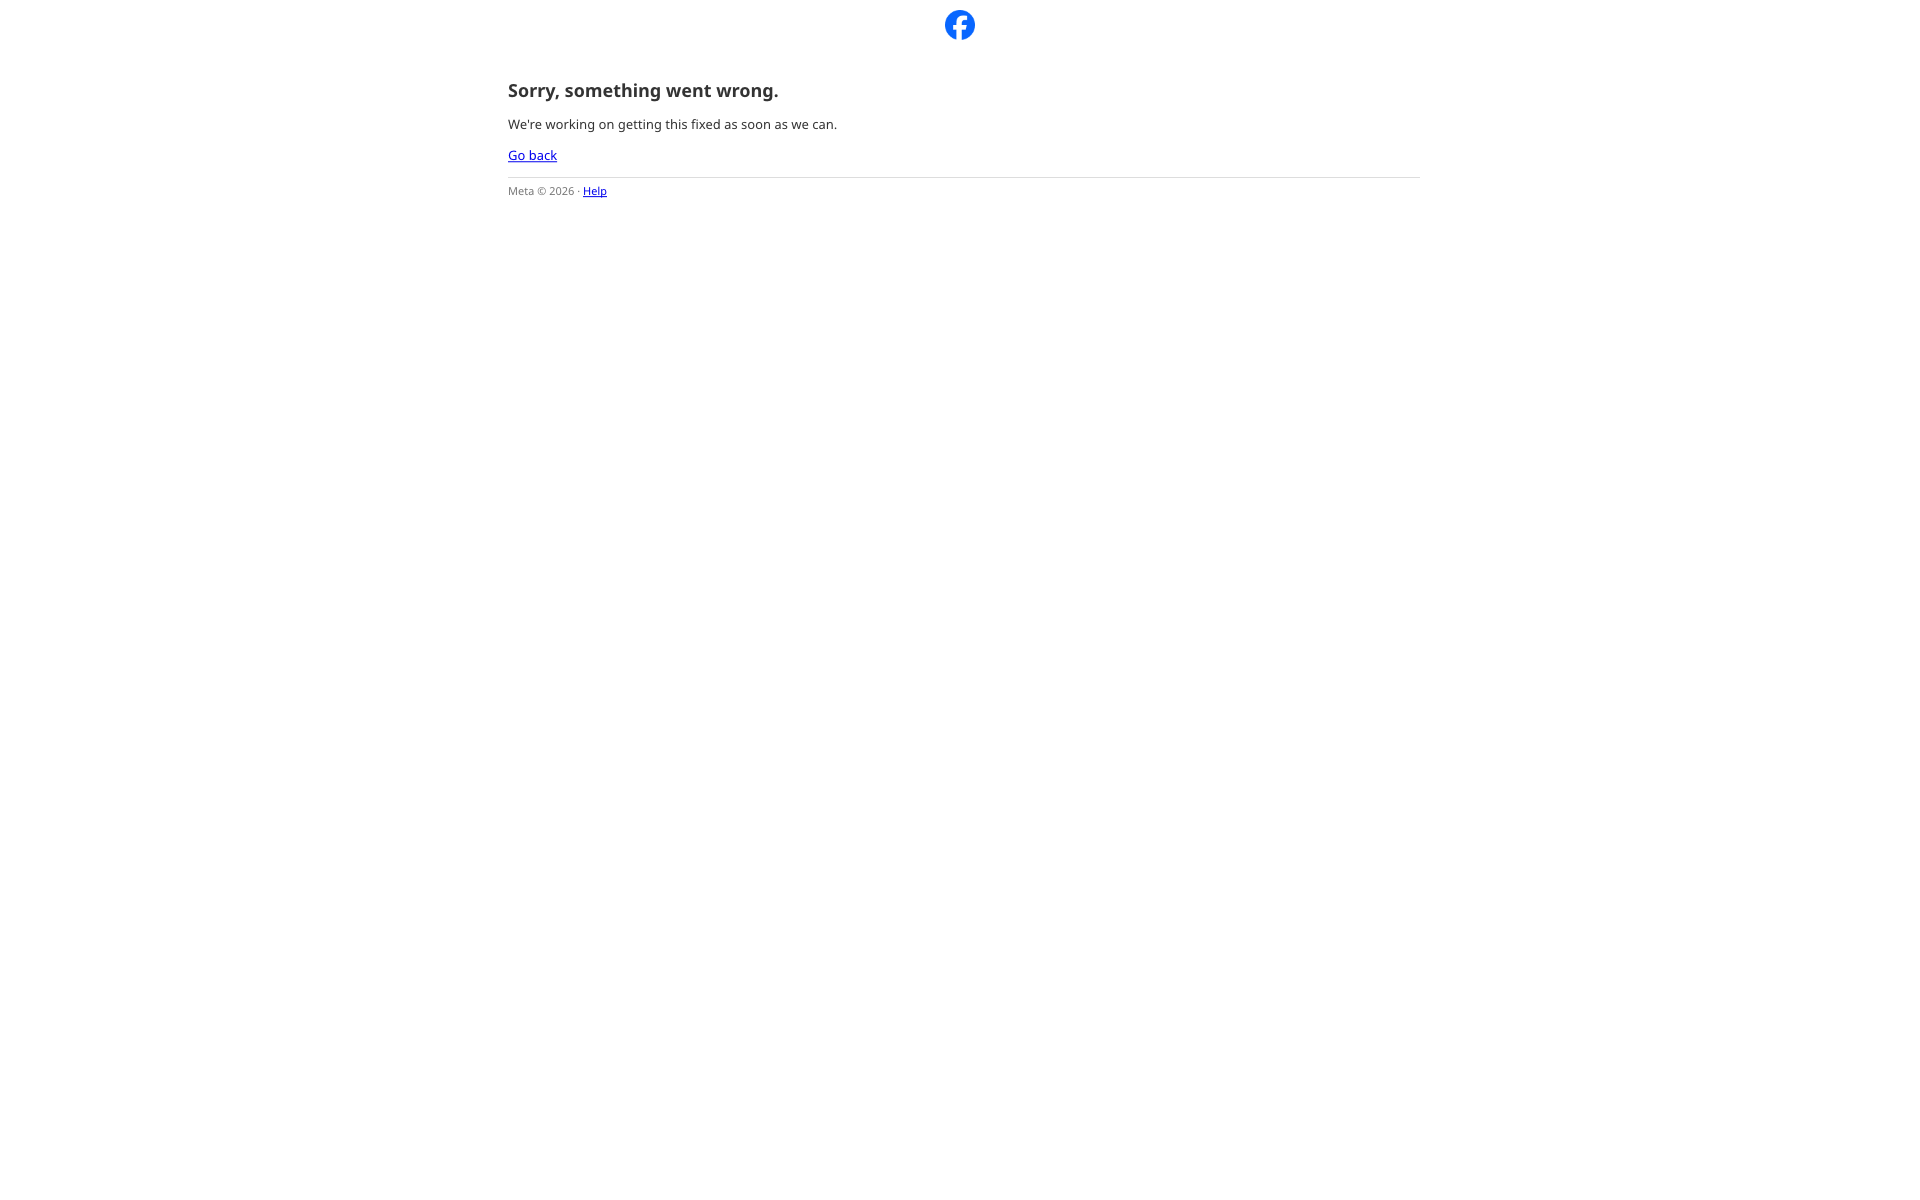
Facebook: a short error page can be fast
The API captures show the public login/marketing page. Kitesurf’s images show “Sorry, something went wrong,” with recorded HTTP 400. Kitesurf’s paired latency ratio for Facebook was about 0.92, yet it produced different content. Lower latency here is not evidence of a better login-page capture.
The API returned the public Facebook entry page. Kitesurf returned an error page. Both produced files that passed the format and dimension checks. Measured round 0; previews reduced to fit. Open the original 1920×1200 API WebP or Kitesurf WebP.Inspect the Facebook pixel difference
Dark pixels changed little; bright pixels changed more. This compares decoded WebP outputs, including different content and loading states. It is not a browser-conformance score. Click the image for the full-resolution PNG.
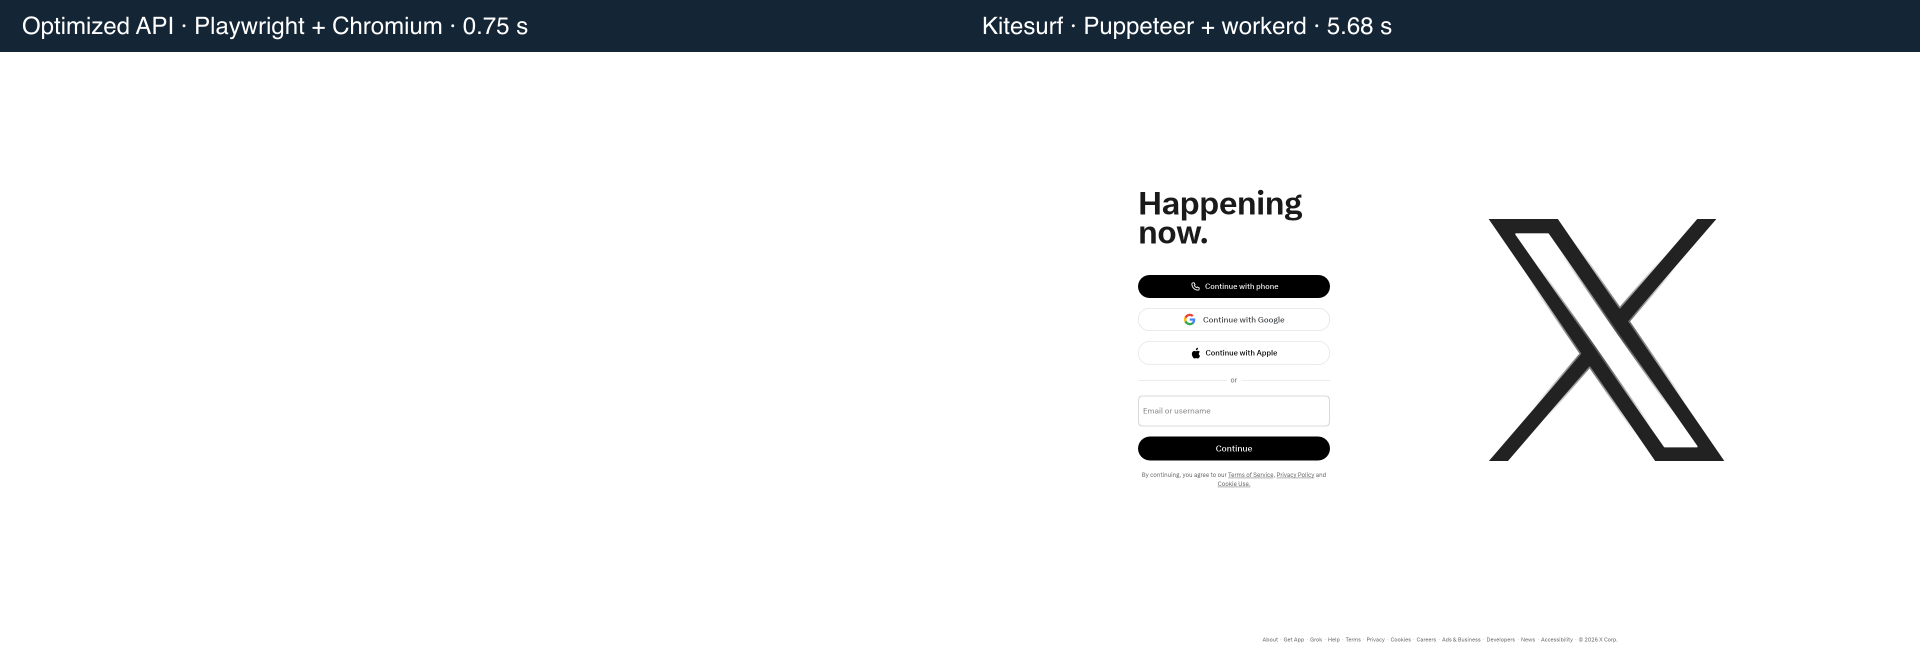
X: the same trap affects our own API
Our API completed its X captures in about 0.75 seconds, while Kitesurf took a measured p50 of 6.42 seconds. That looks like a large API win until the images are opened.
The API returned a blank-looking HTTP 403 image. Kitesurf returned HTTP 200 and a populated sign-in page. The fast blank frame must not be presented as an improvement over the page the other engine actually rendered. We kept this pair in the published data because removing it would hide a weakness in the benchmark’s completion definition.
API: a blank-looking HTTP 403 capture. Kitesurf: a populated sign-in page with HTTP 200. This pair is included in the raw aggregate, which limits how that aggregate can be interpreted. Measured round 0; previews reduced to fit. Open the original 1920×1200 API WebP or Kitesurf WebP.Inspect the X pixel difference
Dark pixels changed little; bright pixels changed more. This compares decoded WebP outputs, including different content and loading states. It is not a browser-conformance score. Click the image for the full-resolution PNG.
There were also sites where Kitesurf produced a useful-looking page and the API produced no measured image. Kitesurf captured both CNN and Walmart in both measured rounds; the API failed both attempts on each. In the opposite direction, the API captured BBC and TikTok twice, while Kitesurf failed both measured attempts on each. These are observed outcomes under this profile and deadline, not permanent compatibility classifications.
Completion and latency across all 25 sites
“Capture” in this table means that a decodable WebP of the requested dimensions was returned before the deadline. It does not mean the page was complete, correct or useful. The p50 columns use completed captures only; a dash means no measured capture completed. With two attempts, p95 is effectively the slower completed sample and is not a useful tail-latency estimate.
Site
API captures
Kitesurf captures
API p50, s
Kitesurf p50, s
Google
2/2
2/2
2.58
5.35
YouTube
2/2
2/2
23.17
12.12
Wikipedia
2/2
2/2
2.39
7.96
Amazon
0/2
0/2
—
—
Facebook
2/2
2/2
2.27
2.10
Instagram
2/2
2/2
1.80
22.11
Reddit
0/2
0/2
—
—
Yahoo
2/2
2/2
24.74
35.87
Bing
2/2
2/2
3.14
21.57
Microsoft
2/2
2/2
8.61
9.93
Apple
2/2
2/2
1.76
7.96
Netflix
2/2
2/2
5.17
9.51
LinkedIn
2/2
2/2
2.02
3.42
X
2/2
2/2
0.75
6.42
TikTok
2/2
0/2
23.29
—
GitHub
2/2
1/2
5.75
10.15
Stack Overflow
2/2
2/2
1.45
2.59
BBC
2/2
0/2
5.88
—
CNN
0/2
2/2
—
10.52
The Guardian
2/2
2/2
22.93
21.61
The New York Times
0/2
0/2
—
—
eBay
2/2
2/2
0.84
2.28
Walmart
0/2
2/2
—
30.78
Booking.com
0/2
2/2
—
1.20
Cloudflare
1/2
2/2
6.77
19.89
Across the measured run, there were 76 completed captures and 24 failures. We retained timeouts, rendering errors, execution-context errors and an engine-crash error rather than replacing difficult sites or selecting a later successful retry. GitHub illustrates the variability: Kitesurf timed out once and completed once; the API completed both attempts.
How the 2.43× ratio was calculated
For each site and round where both stacks completed, we divided Kitesurf’s latency by the API’s latency. We took the median of those paired ratios for each site, then the geometric mean across the 17 eligible sites, giving every site equal weight. Eight sites had no successful pair and did not enter that ratio; their failures remain in the completion table.
This is different from dividing the two p50 columns, or pooling every capture into one global median. It also does not exclude semantically bad screenshots such as the X, Facebook and Yahoo examples. The correct reading is: 2.43× for this definition of completed paired captures, with the coverage and visual caveats above. It is not an estimate of production finished-page latency.
You can recompute the number from the published JSONL using Python’s standard library:
import json
import math
import statistics
rows =[json.loads(line)for line inopen("results.jsonl")if line.strip()]completed ={(r["site"], r["round"], r["stack"]): r["durationMs"]for r in rows ifnot r["warmup"]and r["ok"]}site_ratios ={}for(site, round_id, stack), api_ms in completed.items(): kite_ms = completed.get((site, round_id,"kitesurf"))if stack =="api"and kite_ms isnotNone: site_ratios.setdefault(site,[]).append(kite_ms / api_ms)medians =[statistics.median(values)for values in site_ratios.values()]ratio = math.exp(statistics.mean(math.log(value)for value in medians))print(len(medians),round(ratio,4))# 17, 2.4322
CPU and memory measure the whole local stack
We sampled Linux cgroup counters for each participant container. The API numbers include the JVM, Playwright driver and Chromium subprocesses. Kitesurf’s numbers include its Node controller and local Wrangler/workerd runtime, rather than just the page renderer’s WebAssembly allocation.
Measurement
Optimized API
Local Kitesurf stack
Measured captures completed
37/50
39/50
Active-window CPU / completed capture, including failed work
13.73 CPU-seconds
12.63 CPU-seconds
Observed container-lifetime peak memory
1,865 MiB
3,032 MiB
CPU was accumulated over active sample windows, including failed attempts and prepared-page refill. It excludes time when that participant was idle while the other stack ran. The denominators are different completed-capture counts, so this is a workload-level diagnostic, not a comparison of equal useful images. All measured samples retained resource counters.
Peak memory is a container-lifetime high-water mark. It can include startup, warmups and earlier fixture/pilot activity in a reused container. A restarted container begins a new counter lifetime; the report takes the maximum observed peak across saved samples. These values are not per-page heap sizes, steady-state memory, or a controlled memory comparison of two clean pools.
Cloudflare publishes separate hosted Browser Run measurements. Our local development stack, optimized baseline, page corpus and lifecycle are different. These results neither reproduce nor refute those hosted measurements, and they do not measure Cloudflare billing or infrastructure capacity.
What we would test before a production decision
The useful result of this run is the evidence set and the cases it exposes. Kitesurf can produce recognizable screenshots of real pages, and it completed some pages our profile failed to capture. It also returned skeletons and error responses that a file-level check accepted. Our API had its own empty/error outputs and deadline failures.
A stronger comparison would start with clean containers on isolated native Linux x86-64, more repetitions, and a separately reported stock Playwright control. We would distinguish valid image output from an acceptable page state, normalize fonts where possible, add site-specific visible-state assertions, and report results both with and without HTTP-error/challenge pages. Frozen resource replay could reduce content drift, while a separate live lane would retain real network and bot-response behavior.
Our runner’s longer default is 20 measured rounds with two warmups per site and stack. That longer run has not been performed. Nor did we run a saturation/concurrency test. The active-window throughput field in the downloadable report excludes container restart downtime and should not be treated as maximum sustainable service throughput.
For Kitesurf’s current intended scope and unsupported features, consult Cloudflare’s compatibility guidance, particularly for video, WebGL and bot challenges. A public homepage test cannot establish support for an authenticated application or a long-lived session.
The next browser decision should follow the output your application needs: readable content, a faithful support screenshot, or a usable visual regression reference. Measuring the time to an image is straightforward. Establishing that it is the right image needs its own checks.
We verified the complete attempt matrix and decoded every completed output: 114 valid WebP images across warmups and measured rounds. Both adapters passed the local rendering fixtures, and all 14 runner tests passed. That verifies the harness and artifacts; visual acceptance remains a separate assessment.
 Guide
 Tutorial
 Best Practices